Published on: 2026-05-27
Updated on: 2026-05-27
Wall Street is witnessing an absolute frenzy in the hardware sector as tech giant Dell Technologies Inc. (NYSE: DELL) sees its valuation surge to historic heights. In a week characterized by high-volume buying and shifting market dynamics, Dell stock skyrockets to a fresh all-time high of $305.08 during Tuesday's trading session. This powerful move marks an extension of an incredible bullish run that has left traditional tech majors lagging in its wake.
The meteoric ascent comes at a critical juncture, just forty-eight hours before the round-rocketing enterprise powerhouse reports its fiscal first-quarter 2027 financial results on Thursday, May 28, 2026. Rather than the customary pre-earnings caution that typically dampens speculative volume, institutional investors are aggressively piling into the equity. Shares have climbed roughly 30% over the last five days alone, driving the company's year-to-date gains to a staggering 142%.
What is driving this monumental shift? The answer lies squarely in the company's transformation from a legacy personal computer vendor into a structural titan of high-performance enterprise server infrastructure and next-generation corporate data systems.
This article covers Dell's pre-earnings setup. For post-earnings analysis following Dell's Q1 FY27 results, see our breakdown on https://www.ebc.com/forex/dell-stock-jumps-post-earnings-as-ai-backlog-resets-rally.
The immediate trigger for the latest leg of the rally can be traced back to the flagship Dell Technologies World 2026 conference, which wrapped up late last week. During the event, Chief Executive Officer Michael Dell shared the stage with key industry suppliers, painting a picture of "parabolic" demand for advanced architecture hardware capable of executing heavy, modern data workloads.
The data supporting this aggressive buying wave points to three core operational pillars:
The Massive $43 Billion Order Backlog: Dell entered the current fiscal year with an unprecedented $43 billion order backlog specifically for its high-end, optimized server lines. The velocity of this order growth—which more than doubled in a single quarter—suggests that enterprise demand is scaling faster than public cloud capacity can expand.
The $50 Billion Revenue Target: Management's forward-looking guidance indicates that the company is actively pacing toward $50 billion in pure high-performance infrastructure-related revenue for the fiscal year.
The Lenovo Read-Through: Broader industry sentiment caught a massive tailwind late last week when global competitor Lenovo reported an 84% surge in its advanced infrastructure revenue division. This served as a concrete macro signal that the corporate infrastructure spending boom is translating into realized hardware revenue across the supply chain, rather than just remaining concentrated within component manufacturers.
Furthermore, innovations such as the freshly unveiled PowerStore Elite storage platform and custom-engineered data center solutions built alongside global technology partners have solidified Dell's position as a preferred partner for on-premise corporate deployments.
As Dell stock skyrockets, its fundamental valuation metrics have expanded significantly, forcing Wall Street to reevaluate how it measures a corporate enterprise computing business. Historically priced as a lower-multiple hardware distributor, Dell now trades at a premium tier that reflects its deep secular alignment with next-generation corporate computing requirements.
For the upcoming Q1 earnings report, consensus estimates are calling for a dramatic financial leap. Revenue is projected to rise to roughly $35.71 billion, representing a massive 50% year-over-year expansion. Even more impressively, Wall Street expects non-GAAP earnings per share (EPS) to land at $2.92. nearly doubling the $1.55 recorded during the same period last year.
| Metric | Current Fiscal Position & Q1 Projections | Valuation Context |
| Current Stock Price | $305.08 (All-Time High) | Up ~145% Year-to-Date |
| Q1 Consensus Revenue Estimate | $35.71 Billion | ~50% Year-over-Year Growth |
| Q1 Consensus EPS Estimate | $2.92 | ~88% Year-over-Year Growth |
| Reported Server Backlog | $43.0 Billion | Entered fiscal year 2027 |
| Trailing Price-to-Earnings (P/E) | 34.2x | Reflects premium growth pricing |
| Forward Price-to-Earnings (P/E) | 22.2x | Dependent on backlog conversion |
While the company's gross margins hover near 20%—a thinner profile compared to high-flying pure-play software providers—its infrastructure solutions group (ISG) provides massive scale, consistent free cash flow, and a highly lucrative hardware-software bundling ecosystem. However, with the trailing P/E now sitting over 34x, the market leaves zero room for operational error. Thursday's report must not only match estimates but provide absolute confirmation that the massive backlog is efficiently converting to bottom-line profitability.
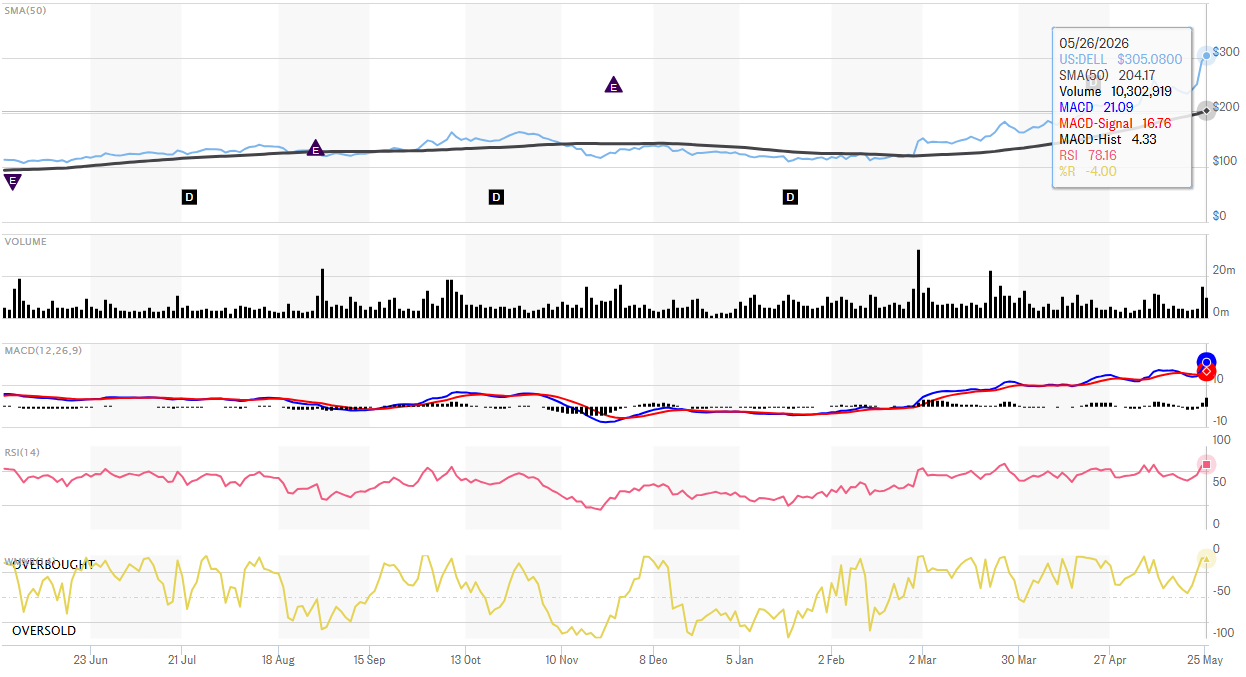
From a charting perspective, the reasons why Dell stock skyrockets become even clearer. The technical architecture of the stock shows a textbook momentum-fueled breakout, with buyers remaining completely in control across short, medium, and long-term horizons.
The equity is currently trading far above its key exponential and simple moving averages. The 20-day Simple Moving Average (SMA) sits at $238.68, while the 50-day SMA trails much lower at $204.17. The fact that the current price of $305.08 sits more than 49% above its 50-day average highlights the parabolic velocity of this trend.
A critical long-term bullish signal occurred back in March when the 50-day SMA crossed decisively above the 200-day SMA, forming a major "Golden Cross." The gap between these two lines has steadily widened, indicating that institutional accumulation has been continuous rather than flash-in-the-pan speculative retail action.
RSI (Relative Strength Index): The 14-day RSI is currently registering at 78.16. Traditionally, a reading above 70 indicates an overbought condition, which can point to near-term exhaustion. However, in major secular growth stories, high RSI readings frequently persist for weeks as capital flows dominate the chart.
MACD (Moving Average Convergence Divergence): The MACD line (12, 26, 9) shows a reading of 16.76, maintaining a wide positive divergence above its signal line. This confirms that the upward momentum is accelerating rather than slowing down.
Williams %R: Sitting at an extreme -4%, this indicator underlines the absolute dominance of the bulls, showing that the stock is repeatedly closing at the absolute top of its recent trading range.
Because the stock is trading at historical highs, it has entered a phase of clear "price discovery," meaning there is no overhead historical resistance. Psychologically, traders are looking at the $310 and $325 marks as the next near-term targets.
On the downside, if the post-earnings reaction triggers a "sell-the-news" profit-taking event, immediate support rests at the previous major breakout zone of $260. Below that, the 20-day SMA near $238 would act as a structural floor.
Options traders are bracing for an incredibly explosive reaction following Thursday's closing bell. According to options market data, current implied volatility is pricing in an expected post-earnings move of roughly 12.10% in either direction. This is significantly wider than the stock's historical average post-earnings move of 4.61% over the past four quarters.
This heightened volatility reflects the massive tension between valuation and execution. Bulls argue that a positive revision to the $50 billion hardware revenue outlook could easily push shares past $350. Conversely, cautious voices on Wall Street, including recent neutral reinstatements from houses like UBS, warn that any mention of supply chain bottlenecks—such as high-bandwidth memory shortages or specialized liquid-cooling component delays—could spark a sharp reality check for a stock priced to absolute perfection.
There is no denying that Dell stock skyrockets on the back of authentic, measurable industrial demand rather than empty speculative hype. The company's $43 billion server backlog represents a concrete pipeline of enterprise investment that will fuel revenue for quarters to come. By securing deeper ties with top-tier chipmakers and launching highly competitive next-gen data storage systems, the Texas-based technology leader has masterfully transformed its market identity.
Concurrently, as the equity trades at historic premiums just prior to its earnings release, the stakes could not be higher. Thursday's first-quarter fiscal 2027 report will serve as an essential litmus test. If the corporate giant successfully demonstrates smooth backlog conversion and robust margin expansion, this jaw-dropping rally may just be the opening chapter of a much larger structural ascent.