Published on: 2025-06-11
Updated on: 2025-06-11
Technical traders rely on candlestick patterns to read market sentiment and anticipate price reversals. Among the most reliable bearish reversal signals in candlestick charting is the Dark Cloud Cover pattern. This two-candle formation is subtle yet powerful, particularly when used with volume, resistance zones, and other confirmations.
In this guide, we'll take a deep dive into the Dark Cloud Cover pattern, explaining its meaning, how to identify it, when to use it, and how it compares to other bearish reversal setups. We'll also explore historical examples and practical trading strategies you can implement in 2025's markets.

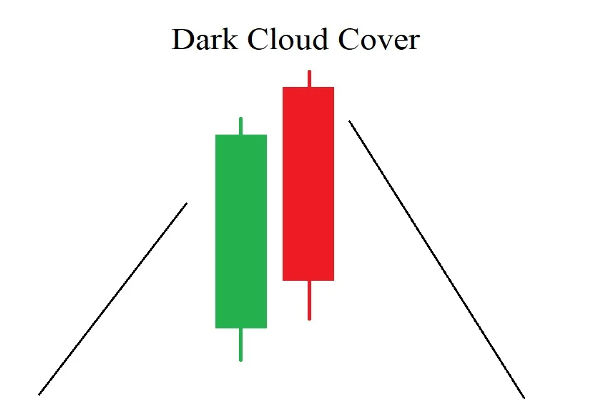
The Dark Cloud Cover is a two-candlestick bearish reversal pattern that typically forms at the top of an uptrend. It signals that bullish momentum is weakening, and sellers are starting to take control of the price action.
This pattern involves a strong bullish (green) candle followed by a bearish (red) candle that opens above the previous day's high but closes well below the midpoint of the prior candle's body. The "cloud" metaphorically refers to the second candle casting a shadow over the bullish sentiment of the first.
Its name, "Dark Cloud Cover," reflects the idea of storm clouds rolling in after clear skies, a visual metaphor for the potential reversal of an uptrend.

To recognise a valid Dark Cloud Cover pattern, you need to observe the following price action over two trading periods:
The first candle is bullish, with a long body showing strong upward momentum.
The second candle opens above the first candle's high (a gap up), creating initial bullish excitement.
Instead of continuing higher, the second candle reverses and closes below the midpoint of the first candle's body.
The second candle is bearish, and its long body shows decisive selling pressure.
This sequence creates a psychological shift in market sentiment. Buyers are caught off guard by the reversal and may rush to exit long positions, adding fuel to the sell-off.
This pattern is crucial because it appears during potential trend exhaustion. Traders interpret the pattern as a signal that bullish enthusiasm has run its course and that sellers may now dominate the market.
It is especially significant when:
It forms near key resistance levels or in overbought conditions.
It appears after a strong uptrend, where profit-taking becomes likely.
Volume increases on the second candle, showing institutional selling pressure.
Unlike some reversal patterns that require three or more candles, the Dark Cloud Cover signals a quick, early warning of a potential top. It's not a standalone guarantee of reversal but a signal that warrants closer attention.
Best Timeframes and Assets
The pattern works across all timeframes, but its reliability improves with higher timeframes:
Daily charts: Most accurate and commonly used.
4-hour charts: Suitable for swing traders.
Weekly charts: Useful for long-term position traders.
It's also effective in major asset classes such as:
Equities (especially high-cap stocks)
Forex pairs (like EUR/USD, USD/JPY)
Commodities (e.g., gold, crude oil)
Indices (like S&P 500 or Nifty 50)
Avoid using it in penny stocks, where price swings are often erratic.
Ideal Market Conditions
Moreover, the pattern is most effective in technical environments. It typically works best in:
Uptrending markets, where the price has risen consistently for multiple sessions.
High-volume stocks or indices which provide confirmation through activity.
Overbought technical indicators, such as RSI above 70, signal that the asset may be ripe for reversal.
It's not ideal to trade the pattern in sideways or low-volatility markets, where it can produce false signals. Confirmation from broader market sentiment and technical indicators greatly increases the reliability of the pattern.

Step 1: Identify the Setup
Begin by spotting an existing uptrend. The asset should signal consistently higher highs and higher lows over several sessions. Once the trend is established, wait for the two-candle formation that defines the Dark Cloud Cover.
The key visual elements to confirm are:
A strong green candle, followed by
A red candle that gaps up and then closes deeply into the first candle's body (below 50%).
Step 2: Look for Confirmation
Though some traders may enter trades based on the pattern, it's generally better to wait for confirmation. It could come in the form of:
A third bearish candle follows the pattern (a continuation day).
A break below a recent support level or trendline.
Increasing trading volume on the second and third days.
Confirmation reduces the risk of getting caught in a false reversal.
Step 3: Set Entry and Exit Points
Once confirmation is established, consider these guidelines:
Entry: You can enter a short position just below the low of the second candle.
Stop Loss: Place a stop above the high of the second candle (the highest point in the pattern).
Target: Use nearby support zones, moving averages, or a fixed risk-reward ratio (like 1:2 or 1:3) to set your take-profit level.
This structure helps you manage risk while capitalising on potential downside momentum.
Example
Let's say a tech stock such as NVIDIA (NVDA) is in a strong uptrend. Over multiple trading sessions, the stock climbs steadily from $650 to $720. On the sixth day, it opens at $725 and closes at $730—a strong bullish candle.
In the next session, the stock opens at $735 (gap up) but sells off sharply, closing at $710. This bearish candle closes well below the midpoint of the previous green candle. Volume is notably higher than average.
The Dark Cloud Cover is now complete.
On the third day, the stock opens flat and continues lower, confirming the reversal. A trader might short the stock below $710 with a stop at $735 and target a retracement to $680 or lower.
This scenario illustrates how institutional profit-taking and sentiment shift can lead to the pattern's success.
No pattern is infallible, and the Dark Cloud Cover has its limitations.
False Signals in Low Volume: It can appear in thinly traded assets or during low-volume hours without meaningful confirmation.
Not Effective in Sideways Markets: In a range-bound market, the pattern might fail to trigger a genuine trend reversal.
Lagging Entry Point: By the time confirmation comes, a significant portion of the move might have already occurred, especially in volatile stocks.
Needs Additional Tools: Traders should support this pattern with other indicators such as RSI, MACD, Fibonacci retracements, or moving averages.
Treat the Dark Cloud Cover as a signal, not a standalone system.
Implementing Risk Management
Implementing risk management is crucial when trading any reversal pattern, including the Dark Cloud Cover. The psychology behind this setup is often emotional, as traders react to sudden shifts in sentiment. As such:
Never risk more than 1-2% of your account on a single trade.
Always use stop-loss orders to protect capital.
Use position sizing calculators based on volatility and trade confidence.
Many traders also utilise divergence signals on oscillators such as RSI or MACD to filter out low-probability trades. For example, if RSI diverges downward while the Dark Cloud Cover appears, the signal becomes stronger.
In conclusion, the Dark Cloud Cover pattern remains one of the most trusted two-candle reversal patterns in technical analysis. Its power lies in its simplicity and the clear message it sends: buyers are losing control, and sellers are stepping in.
While no pattern is foolproof, this setup offers excellent potential when paired with volume, support and resistance levels, and broader market confirmation.
Disclaimer: This material is for general information purposes only and is not intended as (and should not be considered to be) financial, investment or other advice on which reliance should be placed. No opinion given in the material constitutes a recommendation by EBC or the author that any particular investment, security, transaction or investment strategy is suitable for any specific person.