Candlestick charts are among the most widely used tools in technical analysis. They condense a wealth of market information into a single symbol, providing immediate insight into price action, investor psychology, and potential future movements. For centuries, traders have relied on candlestick charts to detect shifts in sentiment and to position themselves accordingly.
This article takes a step-by-step approach to mastering candlestick interpretation, and helps to start with the basics of candle structure before moving into advanced patterns and strategies.
Resetting the Basics: Body, Shadows, and What Candles Tell Us
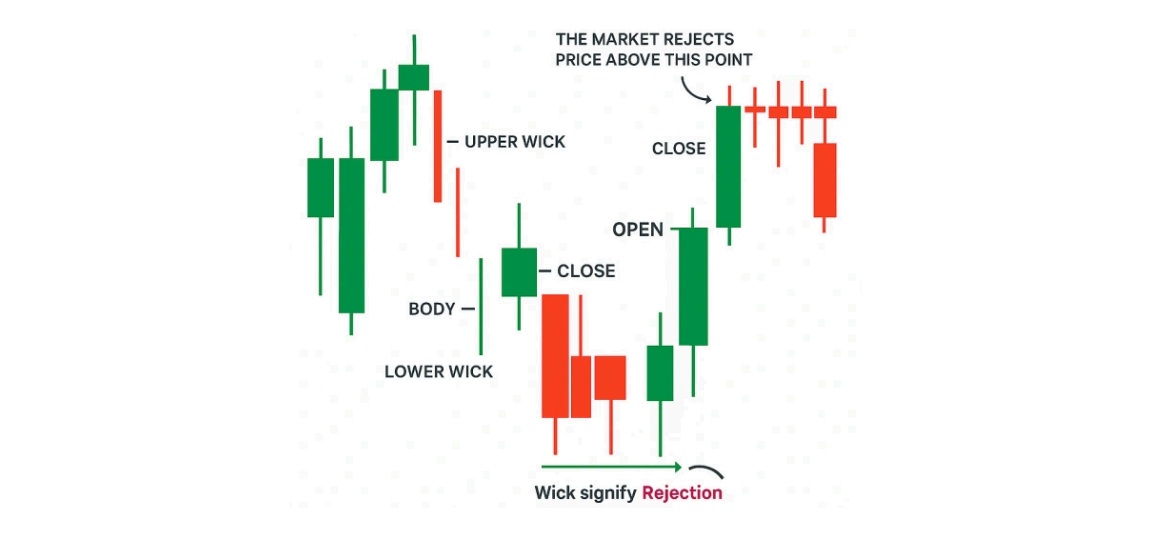
Before diving into advanced methods of how to read stock candles, it is important to revisit their anatomy. Each candlestick represents price movement within a chosen timeframe, such as one minute, one hour, or one day. A candlestick conveys four essential data points:
Open – the price at which the asset began trading in the selected timeframe.
Close – the price at which the asset finished trading in the timeframe.
High – the peak price reached.
Low – the lowest point reached.
The real body of the candle (the coloured rectangular section) shows the range between the open and close. If the close is higher than the open, the candle is typically shaded green (or white), indicating bullish movement. If the close is lower than the open, it is shaded red (or black), signifying bearish pressure.
The upper and lower shadows (wicks) reveal the extremes of price within the timeframe. Long shadows suggest rejection or indecision, while short shadows imply more decisive price action.
Classifying Patterns: Single vs. Double vs. Triple Candlesticks
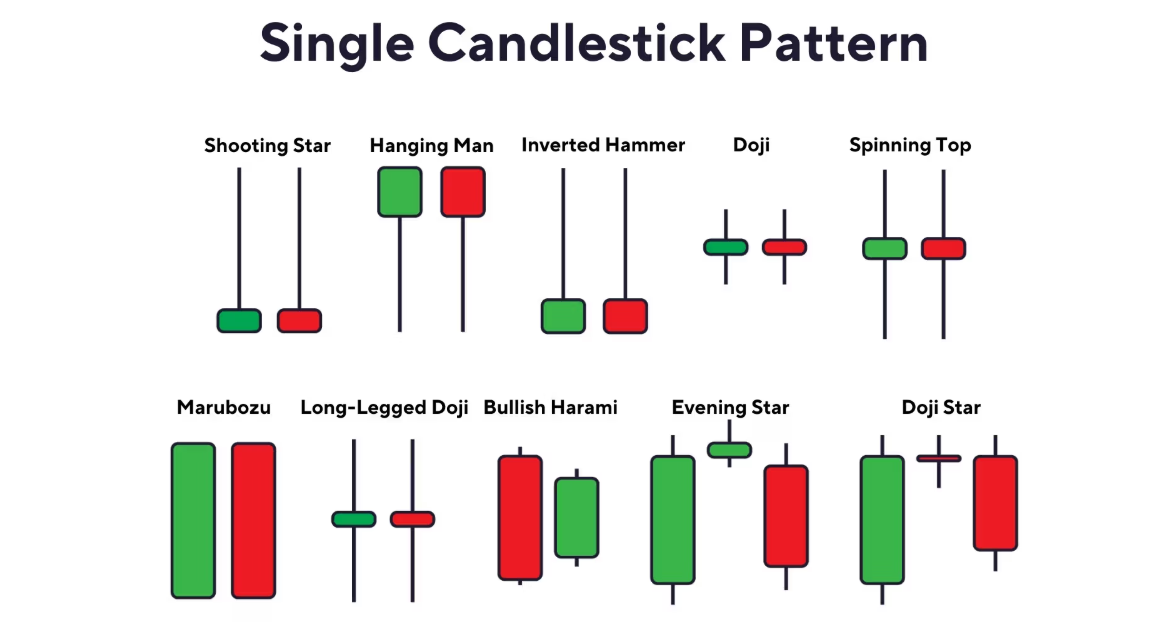
A practical way to approach how to read stock candles is to classify their patterns. These patterns, formed by one or more consecutive candles, can signal continuation, reversal, or hesitation in price trends. Broadly, they are grouped as:
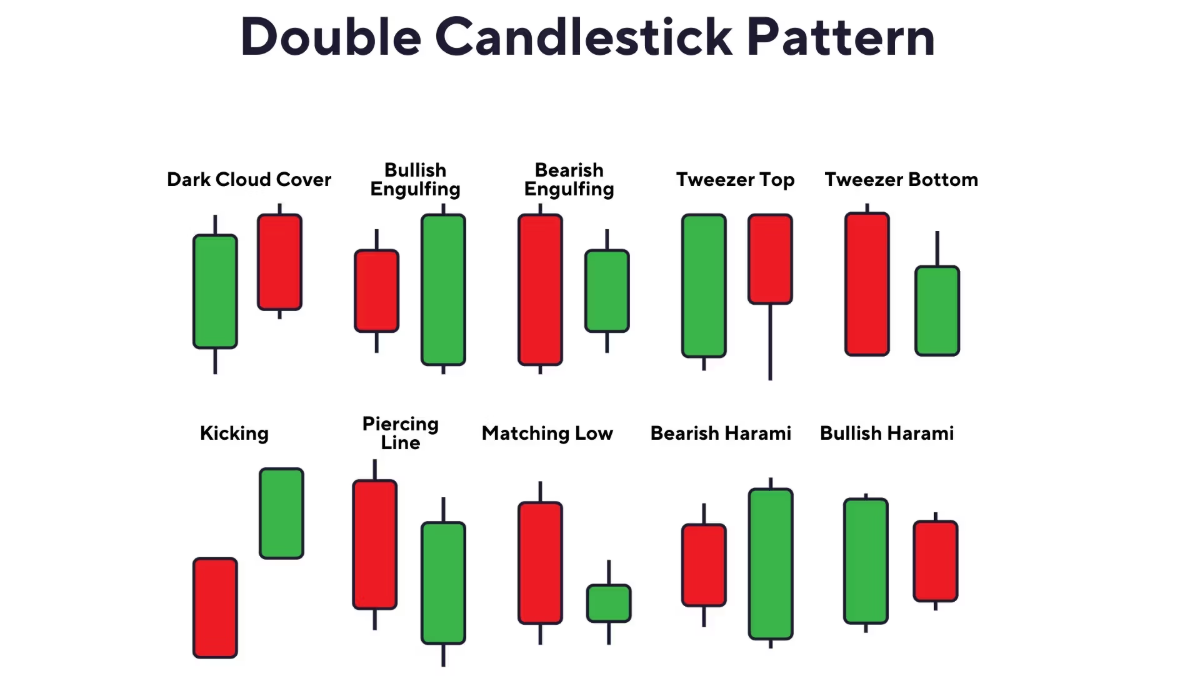
Double-candle patterns – Formed by two candles, e.g. Engulfing patterns, Harami, Tweezer Tops and Bottoms.
Triple-candle patterns – Formed by three candles, e.g. Morning Star, Evening Star, Three White Soldiers, Three Black Crows.
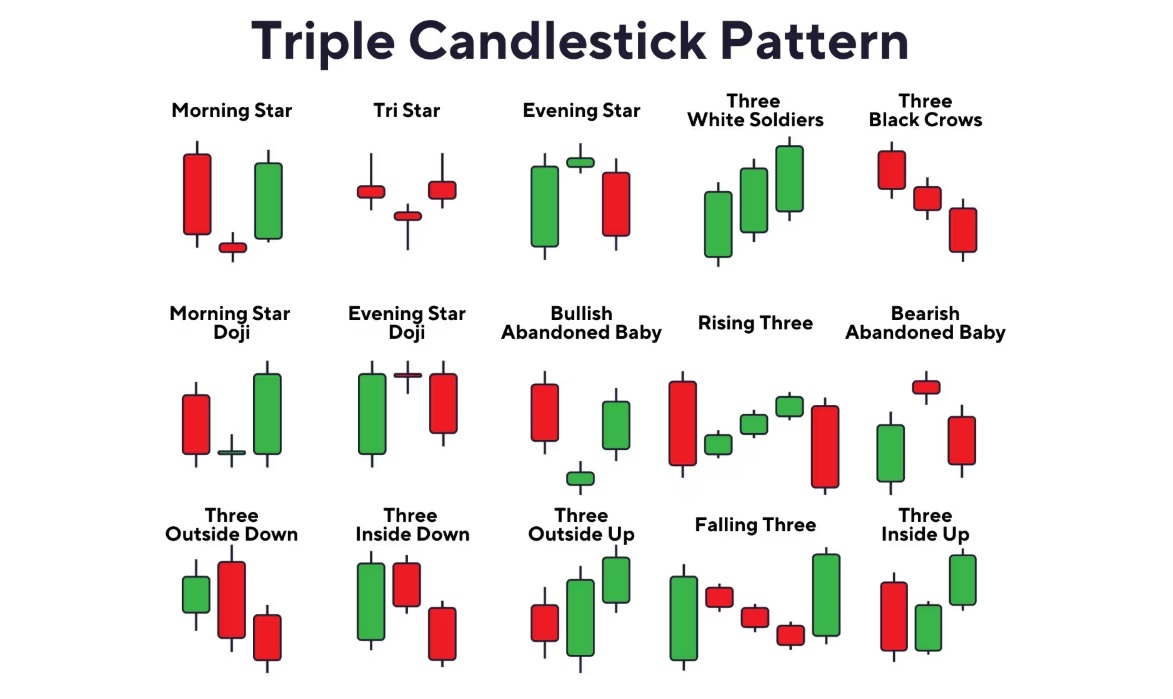
This classification provides a structured framework for identifying and interpreting signals on a chart.
Deep Dive: Hammer, Hanging Man, and Shooting Star Dynamics
Among single-candle patterns, a few stand out for their reliability and psychological significance:
Hammer – Appearing at the bottom of a downtrend, it suggests sellers were overpowered by buyers, hinting at potential reversal.
Hanging Man – Found at the top of an uptrend, it indicates emerging selling pressure and possible reversal.
Shooting Star – Also appearing at the top of an uptrend, it signals a failed push higher, followed by strong rejection.
When learning how to read stock candles, these single-candle formations are essential building blocks. Always consider their placement in the trend and wait for confirmation.
Comprehensive Pattern Catalogue
To expand your understanding of how to read stock candles, here are some of the most widely recognised formations:
Doji and its Variants – Reflect indecision and potential turning points.
Engulfing Patterns – Strong reversal signals where one candle fully covers the previous one.
Harami Patterns – Smaller candles within the prior candle's body, indicating hesitation.
Morning Star & Evening Star – Three-candle reversals signalling bullish and bearish shifts.
Three White Soldiers & Three Black Crows – Indicate powerful continuation in either direction.
Dark Cloud Cover & Piercing Line – Transitional signals between bullish and bearish control.
These structures, when combined with market context, offer traders a valuable roadmap of potential price direction.
Volume, Confirmation, and Reliability Considerations
A common mistake when learning how to read stock candles is relying solely on their visual shape. Several factors improve the reliability of candlestick signals:
Volume – Patterns accompanied by heavy trading volume are more trustworthy.
Confirmation – Wait for the next candle or two to validate a reversal or continuation.
Market Context – Candles near support or resistance levels hold greater significance.
Timeframe – Higher timeframe patterns (daily, weekly) carry more weight than those on minute charts.
Ignoring these factors often leads to false signals and unnecessary losses.
Applying Candlestick Reading in Trading Strategies

Knowing how to read stock candles becomes most effective when integrated into broader strategies. Many traders combine candlestick signals with:
Trend Indicators – Moving averages for directional confirmation.
Momentum Indicators – RSI or MACD to confirm overbought/oversold levels.
Support and Resistance – Candles that align with these levels are highly significant.
Risk Management – Even strong candlestick signals fail, so protective stop-losses are vital.
For instance, spotting a bullish engulfing candle at a strong support level, with RSI divergence, can offer a high-probability entry with defined risk.
Final Thoughts
Learning how to read stock candles is an essential skill for traders and investors alike. Candlesticks compress price action and market psychology into a clear, visual form that is both intuitive and powerful. However, their real value lies in context—combining them with volume, confirmation, and technical indicators.
By mastering these patterns and embedding them into disciplined trading strategies, you gain a sharper edge in recognising market shifts and capitalising on them.
Disclaimer: This material is for general information purposes only and is not intended as (and should not be considered to be) financial, investment or other advice on which reliance should be placed. No opinion given in the material constitutes a recommendation by EBC or the author that any particular investment, security, transaction or investment strategy is suitable for any specific person.
