Published on: 2024-01-16
Updated on: 2024-07-24
Finding a trading system that can sustainably make profits has always been the goal pursued by many traders. In this process, traders are constantly looking for technical tools that suit them, and channel lines are one of the tools that can achieve profits when used independently. Although many people have heard of or used channel lines, in actual operations, many people often spend money based on their feelings, resulting in improper use of technical tools and ultimately losses. In this article, we will delve into the principles and drawing methods of channel lines, hoping to help traders avoid detours and achieve more profits.

1. The Concept of Support and Resistance Trend Lines
Before discussing channel lines, we first need to understand the concept of support and resistance trend lines. Support refers to the phenomenon that the stock price stops falling after falling to a certain level and begins to rebound. This level is seen as a place where buying is strong in the market, and investors are willing to buy the stock at this price, forming a support point for the price.
On the contrary, resistance refers to the phenomenon that the stock price stops rising after rising to a certain level and begins to fall back. This level is seen as a place where selling is strong in the market and investors are willing to sell the stock at this price, creating a price resistance point.
A trendline is a straight line connecting high or low points in a stock's movement to show the direction of the price movement. In technical analysis, trend lines are divided into upward trend lines (support lines) and downward trend lines (resistance lines).
Uptrend Line: Connects the low points of the price to form an upward straight line, indicating that the stock price is in an upward trend.
Downward Trend Line: connecting the high points of the price to form a straight line downward, indicating that the stock price is in a downward trend.
By drawing trend lines, investors can more clearly see the direction of the stock price, which helps determine the market trend.
2. The Concept of Channel Lines
Channel lines are a technical tool based on price movement and are defined as parallel lines to the positioning lines. The so-called channel line, also known as "pipeline line" and "return line," is another application of trend line technology. It is to draw a straight line parallel to the trend line in the opposite direction of the trend line, and the straight line crosses nearly The highest or lowest point of price during a period, used to show the range of price fluctuations, is formed by simultaneously drawing support and resistance lines on a price chart. The purpose of channel lines is to help traders identify possible upward or downward trends in price, as well as extreme levels of price movement.
Channel lines usually include the following two main lines:
Support Line: This is a line formed by connecting the low points of two or more trends on a price chart. A support line shows the level at which the price might find support if it falls.
Resistance Line: This is a line formed by connecting the high points of two or more trends on a price chart. The resistance line shows the level at which the price may encounter resistance if it rises. These two lines run with a price sandwiched in the middle, with a clear pipe or channel shape.
3. Important Features of Channel Lines Include:
Trend identification: By observing the trend of channel lines, traders can identify whether the price is trending upward, downward, or sideways.
Range: Channel lines show the range of price movement between support and resistance. This helps traders understand how much price movement is likely to occur.
Trading signals: When the price touches the upper or lower limits of a channel line, this may generate a trading signal. For example, when the price approaches the upper limit of a channel, it may be a signal to sell, while when it approaches the lower limit, it may be a signal to buy.
Trend Strength: The width of the channel can reflect the strength of the price trend. A wider channel may indicate a stronger trend, while a narrower channel may indicate a relatively weaker trend.
4. How to Draw Channel Lines
Choose a time frame: First, choose an appropriate time frame, which determines the range of support and resistance points chosen on the price chart. Short-term and long-term time periods can lead to different support and resistance points.
Identify Lows and Highs in Trends: Identify lows and highs in trends on a price chart over a selected time period. Lows are used to draw support lines, while highs are used to draw resistance lines.
Draw a Support Line: Connect two or more low points in a trend to form a support line. These lows usually correspond to price rebound points, showing possible support levels.
Draw a Resistance Line: Connect two or more high points in a trend to form a resistance line. These highs usually correspond to lower points in price, showing possible resistance levels.
Channel formation: The area formed between the support line and the resistance line is the channel. The channel shows the range in which the price fluctuates between these two levels.
Observe trends and fluctuations: By observing the trend of channel lines, you can identify price trends and fluctuation ranges. The width of the channel can reflect the strength of the trend, while the touch of the channel line can provide trading signals. The way channel lines are drawn can vary depending on the trader's preference and analysis method. Some traders may focus more on short-term fluctuations, while others may focus more on long-term trends.
5. The Difference between Support and Resistance Trend Lines and Channel Lines
Support and resistance Trendlines typically refer to lines on a stock or other financial asset price chart that show the levels at which prices may encounter support or resistance. While they are related to channel lines to some extent, they are not exactly the same.
A support trendline is a line drawn by connecting two or more lows on a price chart, indicating that the price may find support during a decline and rebound upward.
A resistance trendline is a line drawn by connecting two or more high points on a price chart, indicating that prices may encounter resistance as they rise and fall.
Channel lines are usually formed by support and resistance lines that encompass the range of price fluctuations to form a channel. This channel helps traders identify possible upward or downward trends in price.
Drawing method:
Support and Resistance Trendlines: Both are drawn by connecting low points (support lines) or high points (resistance lines) on the price chart. Support and resistance lines are usually drawn separately to show possible support and resistance levels for a price.
Channel Lines: Channel lines are formed by drawing support and resistance lines simultaneously. The area between the support and resistance lines forms a price channel and is used to show the range of price fluctuations.
How to Use:
Support and Resistance Trendlines: They are primarily used to indicate possible support and resistance levels for a price, helping traders determine possible buying or selling points.
Channel Lines: In addition to showing support and resistance levels, channel lines also provide the likely range of price movement. Channel lines can help traders identify the strength and direction of a trend.
Formation pattern:
Support and Resistance Trendlines: They are usually formed by connecting the lows or highs in a trend on a price chart.
Channel Lines: Channel lines are formed by simultaneously connecting the lows and highs in a trend on a price chart.
Support and resistance trendlines focus
primarily on a price's support and resistance levels, while channel lines more
broadly provide a price's range of movement. Channel lines and trend lines are a
pair that cooperate with each other and have a relationship of interdependence
and mutual correction. The method of breakthrough and whether the volume is
increased will have a greater impact on the market's future operations.
Obviously, there are trend lines first and then channel lines. Trend lines are
much more important than channel lines. Trend lines can stand on their own,
while channel lines cannot.
| Distinction | Support Trendline | Resistance Trendline | Channel Line |
| Drawing Method | Connects lows in price chart | Connects highs in price chart | Simultaneously draws support and resistance lines |
| Formation Pattern | Connects lows in trend | Connects highs in trend | Simultaneously connects lows and highs in trend |
| Purpose | Indicates possible support levels, helps identify buying points | Indicates possible resistance levels, helps identify selling points | Displays support, resistance levels, and price fluctuation range, aids in identifying trend strength and direction |
| Focus Points | Supports finding support when prices are falling | Hinders encountering resistance when prices are rising | Provides price fluctuation range, assists in judging trend strength |
| Interrelationship | Independently drawn, separate lines | Independently drawn, separate lines | Cooperative, drawn simultaneously |
| Relative Importance | Relatively high importance, trendline precedes | Relatively high importance, trendline precedes | Relatively lower importance, depends on the existence of trendlines |
6. Classification of Channel Lines
Subdivision channel lines can be classified based on factors such as trend direction, shape, and market stage.
Trend direction:
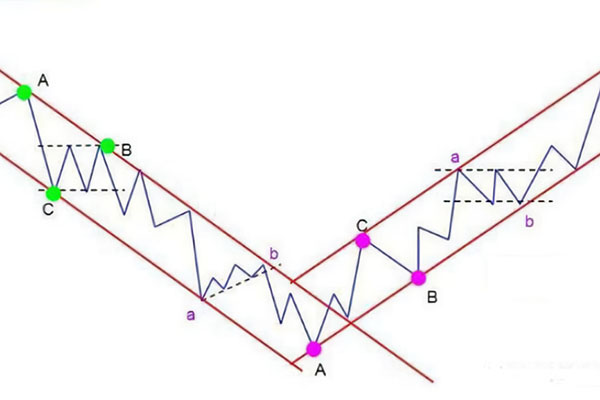
Ascending Channel: Both the support and resistance lines are sloping upward, indicating that the price may be in an upward trend.
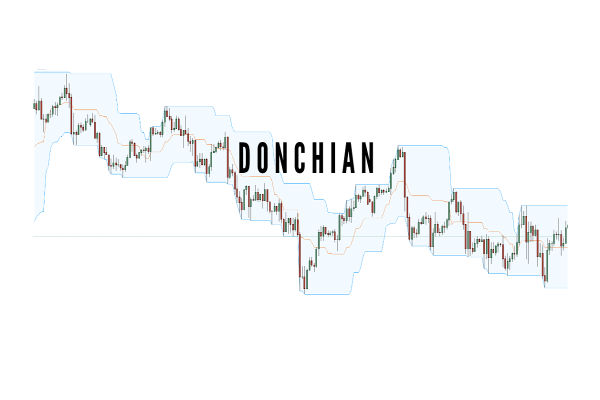
Descending Channel: Both the support and resistance lines are sloping downward, indicating that the price may be in a downward trend.
shape:
Parallel channel lines: The support and resistance lines are parallel, indicating that the price fluctuates within a certain range.
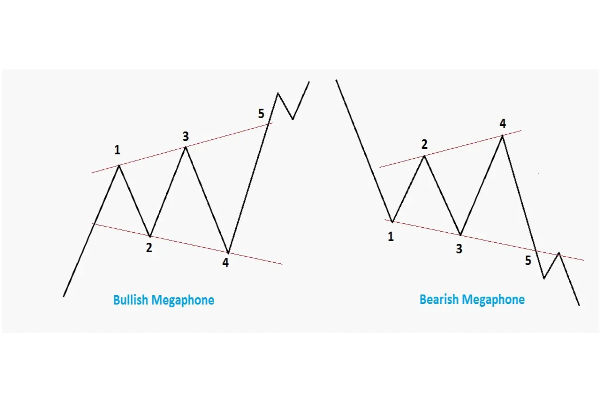
Expanding Channel Lines: Support and resistance lines are gradually widening, which may indicate an increase in the strength of the trend.
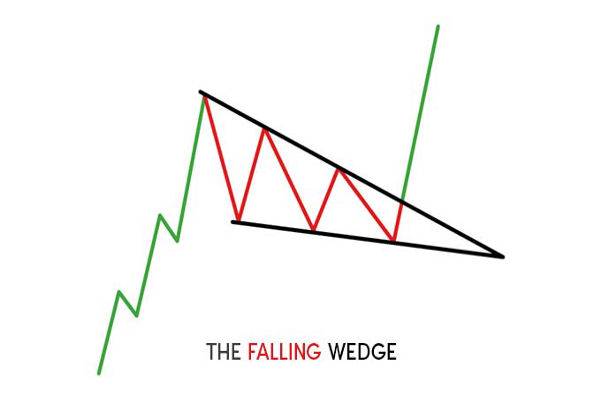
Converging channel lines: The support and resistance lines are gradually narrowing, which may indicate that the range of market fluctuations is decreasing.
Market stage:
Bull market channel: a channel formed in a bull market with an obvious upward trend and price fluctuations within the channel.
Bear market channel: a channel formed in a bear market with an obvious downward trend and price fluctuations within the channel.
Sideways Channel: A channel formed when the market is sideways or consolidating, with prices fluctuating between support and resistance.
Time period:
Short-term channel: a channel that forms over a shorter period of time and usually reflects short-term price fluctuations.
Medium-term channel: a channel that forms over the medium-term period and usually reflects the medium-term price trend.
Long-Term Channel: A channel that forms over an extended period of time and usually reflects long-term price trends.
These more detailed classifications help traders understand the nature of channel lines more specifically and make more refined market analyses based on different market conditions. In actual trading, choosing the appropriate channel line type according to different situations can improve the accuracy of trading decisions.
7. The Relationship between Channel Lines and Trading Volume
Trend confirmation:
When price trends in the direction of a channel line, an increase in volume can be a sign of trend confirmation. For example, in an ascending channel, rising prices are accompanied by increasing volume, which may indicate that the strength of the trend is increasing.
Trend reversal:
When price trends in the opposite direction of the channel line, changes in volume may signal the possibility of a trend reversal. For example, in a descending channel, if price falls but volume falls, this may signal that selling pressure is waning and that a trend reversal may be in sight.
Volume confirms the breakout:
When price breaks through a channel line, if it is accompanied by an increase in volume in the corresponding direction, this may increase the reliability of the breakout. High volume may indicate consensus among market participants, adding credibility to a price move.
Divergence signals:
When there is a divergence between channel lines and volume, it can signal a trend reversal. For example, if volume declines while prices are making new highs, this could indicate weakening market power and could be a sign of a reversal.
Recognition of sideways markets:
In sideways markets where prices fluctuate between channel lines, changes in volume may be more informative. For example, in a sideways market, if price fluctuates between channel lines but volume is relatively low, this may indicate a lack of directionality in the market.
Confirmation of abnormal fluctuations:
When a price moves abnormally near a channel line, an increase in trading volume may confirm the authenticity of the move. Unusual moves accompanied by larger trading volumes may indicate a strong reaction from market participants.
8. Channel Line Applications Explained
Channel lines are widely used in actual investment. Investors can judge the market's buying and selling pressure by observing the fluctuations of stock prices within the channel and conducting buying and selling operations at the appropriate time.
When the stock price touches the upward trend line, investors can consider buying because this may be a support point and the stock price may rebound.
When the stock price hits the downward trend line, investors can consider selling because this may be a resistance point and the stock price may fall.
When the stock price fluctuates within the channel, investors can adopt a trend-following strategy and follow the trend.
9. Risks and Precautions of Channel Lines
False Signs of a Trend Breakout:
A price breakout of a channel line does not necessarily indicate an ongoing trend. Sometimes, the price may just break out briefly and then move back into the channel. This can lead to false trading signals, causing traders to enter or exit the market when they don't need to.
Market emergencies:
Unexpected events or major news can cause the market to fluctuate wildly, breaking channel lines and rendering them ineffective. In extreme cases, access lines may not provide adequate protection, resulting in damage.
Oscillations during market sideways periods:
During periods of market sideways, prices may oscillate up and down channel lines without forming a clear trend. In this case, the trading opportunities that the channel lines may provide are relatively limited.
Overfitting:
Over-reliance on past price data to draw channel lines can sometimes lead to overfitting issues. Overfitting may cause the channel line to adapt to past price fluctuations, but it may not be predictive of future market changes.
Inconsistency in different time periods:
The shape and position of the channel lines can vary over different timeframes, resulting in conflicting signals. Traders should choose an appropriate time frame based on their trading strategy and time preference.
Interference from market noise:
Short-term noise and volatility in the market can make the interpretation of channel lines more difficult. In the short term, prices may fluctuate within channels due to noise and not necessarily reflect the true trend.
The effects are different in different market environments.
The effectiveness of channel lines may depend on the different circumstances of the market, such as a choppy market, a trending market, or a sideways market. The reliability of channel lines may vary under different market conditions.
As a powerful tool for technical analysis, channel lines provide investors with a clearer and more intuitive picture of stock price trends. Through learning and practice, investors can better master the use of channel lines and improve the accuracy and profitability of transactions. Improve market sensitivity and judgment through continuous learning and practice. Only in the process of continuously accumulating experience can investors make better use of this technical tool and achieve better investment returns.
Disclaimer: This material is for general information purposes only and is not intended as (and should not be considered to be) financial, investment or other advice on which reliance should be placed. No opinion given in the material constitutes a recommendation by EBC or the author that any particular investment, security, transaction or investment strategy is suitable for any specific person.


World's Best Broker