Published on: 2025-07-25
Updated on: 2025-07-25
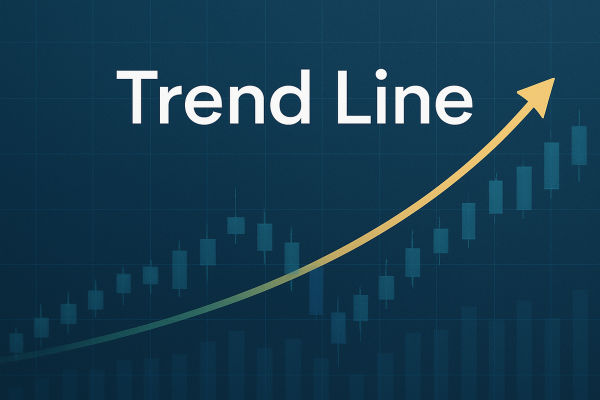
A trend line is one of the most fundamental tools in technical analysis. It is a straight line drawn on a chart that connects a series of price points to show the prevailing direction of the market. Traders use it to identify support and resistance levels, spot trend continuation or reversal patterns, and time their entries and exits more effectively.
In its simplest form, a trend line connects two or more significant price highs or lows. An upward trend line is drawn below price and slopes higher, connecting higher lows, while a downward trend line sits above price, connecting lower highs. Whether you trade forex, stocks, or cryptocurrencies, understanding how to use a trend line can significantly enhance your market analysis.

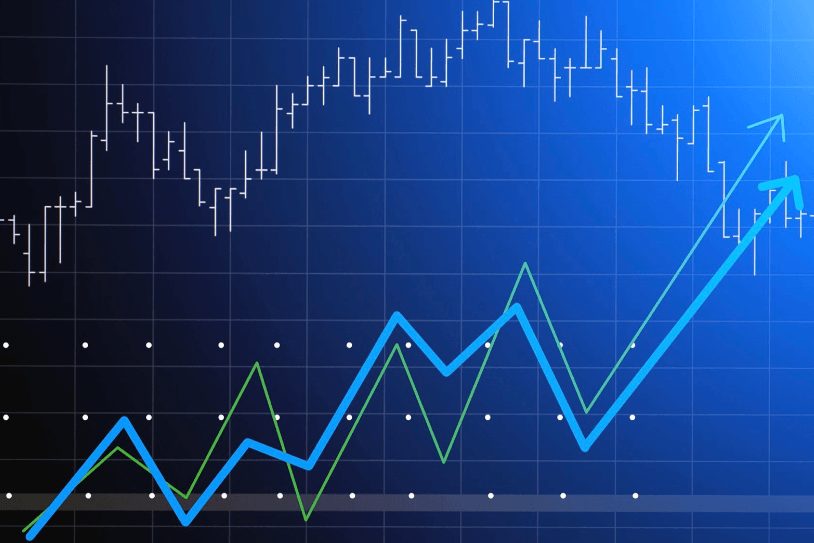
The importance of a trend line lies in its ability to provide visual clarity in a sometimes chaotic market. Markets rarely move in a straight path. They swing, retrace, and consolidate. A trend line helps filter this noise by showing the underlying direction of the price movement.
Traders rely on trend lines to define the structure of a trend. In an uptrend, a trend line serves as a dynamic support level. In a downtrend, it acts as a resistance level. As long as the price respects the trend line, the trend is considered intact. Once it breaks decisively, it could signal a potential reversal or at least a pause in momentum.
Using a trend line effectively allows traders to avoid counter-trend trades and align themselves with the market's prevailing direction. This is particularly helpful for managing risk and improving timing.

While drawing a trend line may seem straightforward, doing it correctly requires consistency and discipline. The first step is identifying at least two significant swing points in the price action. These are the peaks or troughs that stand out in a chart. In an uptrend, you connect the lows. In a downtrend, you connect the highs.
The best trend lines are drawn using closing prices rather than wicks, although some traders prefer the opposite depending on their style. What matters most is consistency. A trend line should be adjusted only when the market structure shifts. Redrawing it too frequently can lead to confusion and false signals.
It is also important to ensure the line is not forced to fit the market. A valid trend line should touch multiple points and still reflect a realistic slope. If the angle is too steep or too flat, it may not hold value as a support or resistance reference.
Many traders misuse trend lines by either overcomplicating them or relying on them too heavily. A trend line is a guide, not a guarantee. Just because a price touches a trend line does not mean it will bounce. The market is driven by volume, sentiment, and macroeconomic factors that often override technical patterns.
Another common mistake is ignoring timeframe relevance. A trend line that looks solid on a five-minute chart may not hold any weight on a daily or weekly chart. The higher the timeframe, the more reliable the trend line usually is.
Also, placing trades solely based on a trend line without confirmation can lead to losses. It is always better to use it in combination with other tools like candlestick patterns, moving averages, or volume indicators.

Once you've drawn a valid trend line, it can serve multiple purposes. It can act as a reference for trend-following trades, where you enter positions in the direction of the prevailing move. For example, in an uptrend, you might wait for the price to pull back to the trend line before entering a long position. If the line holds, it can signal a strong continuation.
Trend lines can also help with breakout strategies. When a price breaks through a well-respected trend line with strong momentum, it can indicate a trend reversal or the start of a new phase. However, not every break is significant. False breakouts are common, which is why traders often wait for a retest or confirmation before acting.
Some traders use trend lines to set stop-loss or take-profit levels. Placing a stop just below an uptrend line or above a downtrend line can help limit losses in case the market reverses. Likewise, if a price approaches a trend line from the opposite direction, it can serve as a reasonable exit point.
While a trend line on its own is helpful, its power is magnified when used with other technical indicators. For example, combining a trend line with a moving average can reinforce the directional bias. If both suggest the same trend, it adds confidence to a trade setup.
Oscillators like RSI or MACD can also be used alongside a trend line. If the trend line signals a possible reversal and an indicator shows divergence, the case for a trend change becomes stronger. Volume analysis can further confirm whether a trend line break is meaningful.
Ultimately, a trend line is a visual representation of price dynamics. When it aligns with broader market context and supporting signals, it becomes a highly valuable part of your trading toolkit.
Mastering the use of a trend line is essential for anyone involved in technical trading. It may seem simple at first glance, but its correct application requires attention to detail, market awareness, and experience. A trend line helps define market structure, highlights potential entry zones, and clarifies when a trend is gaining or losing strength.
By understanding what makes a trend line valid, how to draw it accurately, and how to interpret price behaviour around it, you can make more informed decisions in any market. Like all tools, it works best when used with others and within a disciplined strategy. Whether you are a beginner or a seasoned trader, never underestimate the value of a well-placed trend line.
Disclaimer: This material is for general information purposes only and is not intended as (and should not be considered to be) financial, investment or other advice on which reliance should be placed. No opinion given in the material constitutes a recommendation by EBC or the author that any particular investment, security, transaction or investment strategy is suitable for any specific person.