Published on: 2025-05-30
Updated on: 2025-10-27
Markets in 2025 are faster, more volatile, and increasingly driven by data, algorithms, and global events. To succeed, traders need more than instinct, they need clear signals to guide their decisions.
From momentum indicators like RSI and MACD to institutional footprints captured by smart money concepts, these signals help traders move from guesswork to strategy.
Whether you’re a beginner or an experienced trader, understanding and applying these tools can improve accuracy, reduce emotional mistakes, and give you an edge in modern markets.

Trading signals are indicators that help traders decide when to buy or sell an asset.
They can come from technical analysis, like moving averages or RSI, from price patterns, volume changes, or even from market news and sentiment.
Think of them as alerts that highlight opportunities: a sudden surge in trading volume might hint that a stock is about to move, or a “golden cross” in moving averages could suggest a bullish trend.
To put it simply, a trading signal acts like a compass, guiding you toward potential market moves instead of relying purely on guesswork or emotion.

Here’s a quick comparison to show how different strategies stack up in terms of risk, reward, and timing.
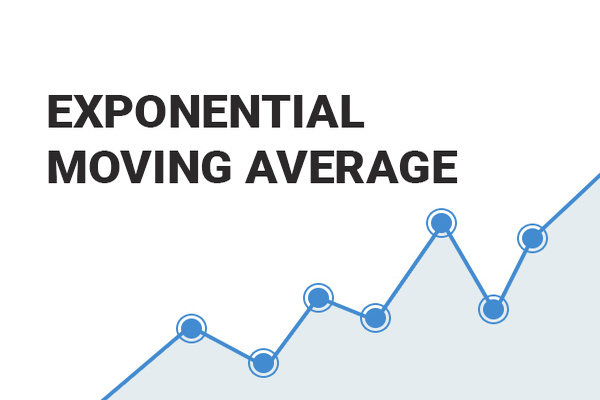
When To Use: Identify trend changes when a short-term moving average crosses a long-term moving average.
Relevance in 2025: Still reliable for trend detection; AI tools now automate detection for faster decision-making.
 When To Use: Spot overbought or oversold conditions.
Relevance in 2025: Essential in volatile markets for timing entries and exits.
When To Use: Confirm momentum shifts or trend reversals.
Relevance in 2025: Widely used, works well with algorithmic trading and smart charting.
When To Use: Detects volatility extremes and potential breakouts.
Relevance in 2025: Useful for crypto, commodities, and high-volatility assets.
When To Use: Enter trades when price breaks support or resistance levels.
Relevance in 2025: AI and real-time volume make breakouts easier to spot and act on.
When To Use: Confirm the strength of a move or anticipate reversals.
Relevance in 2025: Institutional activity often shows up in volume before price reacts.
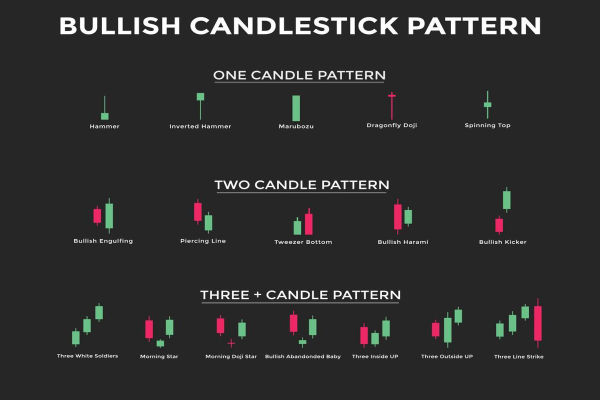
 When To Use: Recognize short-term reversals or continuation.
Relevance in 2025: Automated pattern recognition makes these more accessible than ever.
When To Use: Plan entries and exits around key support and resistance levels.
Relevance in 2025: Psychological significance remains strong; widely used in trading algorithms.

When To Use: Identify trend, support/resistance, and momentum in one chart.
Relevance in 2025: Trend-followers rely on it for multi-timeframe insights.
When To Use: Track institutional behavior versus price action.
Relevance in 2025: Increasingly relevant for spotting high-probability trades and market manipulation.

As of 2025, markets are more automated, data-driven, and volatile than ever. Traders need a clear framework to:
React quickly to price changes
Reduce guesswork
Improve consistency
Manage risk more effectively
With high-frequency trading, volatility, AI tools, and economic uncertainty, using trading signals can help both novice and advanced traders stay ahead of the curve.
Not every signal works for every trader or market. Stocks, crypto, forex, and commodities respond differently to technical, fundamental, and sentiment-based indicators.
Day traders may rely on momentum and volume spikes, while swing traders can combine moving averages with RSI or MACD.
Understanding which signal suits your trading style helps reduce noise, prevent overtrading, and increase the probability of success.
Concrete examples make trading signals easier to grasp.
For instance, in October 2025, a tech stock might surge ahead of a product launch. Traders using moving average crossovers and volume spikes could anticipate the trend and time their entry.
After the announcement, early sellers capture profits while latecomers face a pullback. Similarly, crypto markets often react to regulatory news, making sentiment and breakout signals highly relevant.
Showing how signals work in practice reinforces strategy application and risk awareness.
Modern trading relies heavily on technology. AI-driven charting platforms can automatically detect patterns like MACD divergences or Fibonacci retracements.
Social sentiment trackers highlight emerging market rumours, while algorithmic alerts can signal volume surges in real time. Using these tools smartly allows traders to act faster, filter noise, and combine multiple signals efficiently.
Even beginners can leverage tech to monitor markets without being glued to screens all day.

Markets in 2025 are fast, volatile, and influenced by global events and AI-driven tools. Trading signals are becoming smarter and more accessible, helping both beginners and experienced traders spot trends, volume changes, and sentiment shifts in real time.
Event-driven signals and momentum strategies remain important as markets react quickly to news, central bank decisions, and crypto movements. Traders who use signals wisely, combine them with proper risk management, and stay disciplined are more likely to succeed.
In short, trading signals will stay a key tool, but understanding how to read them and act at the right moment will separate successful traders from the rest.
A trading signal is an alert or indicator suggesting when to buy or sell an asset, based on technical, fundamental, or sentiment analysis.
No. They guide decisions, but markets are unpredictable. Proper timing, risk management, and discipline are crucial.
Volatile markets with frequent news: stocks around earnings, forex during central bank updates, commodities on supply shifts, and cryptocurrencies.
Trading signals guide smarter decisions in fast-moving markets. In 2025, combining them with risk management and timely execution is key. No signal guarantees profit, but used wisely, they help traders act with confidence across stocks, forex, commodities, and crypto.
Disclaimer: This material is for general information purposes only and is not intended as (and should not be considered to be) financial, investment or other advice on which reliance should be placed. No opinion given in the material constitutes a recommendation by EBC or the author that any particular investment, security, transaction or investment strategy is suitable for any specific person.