Published on: 2025-10-27
Updated on: 2025-10-27
In trading, price movements resemble waves on the sea. Each swell rises, builds, and eventually breaks, and traders who understand this rhythm can ride the momentum before it reverses. The Parabolic SAR acts as a surfboard for those waves, offering a clear, visual way to stay with a trend until it loses strength.
Short for "Stop and Reverse," the Parabolic SAR is a classic technical indicator designed to help traders identify the direction of a trend and when it may be about to turn. In 2025, as global markets experience rapid price changes driven by economic data and algorithmic trading, mastering this tool can help traders avoid hesitation and act with precision.

The Parabolic SAR (Stop and Reverse) is a trend-following indicator created by J. Welles Wilder Jr. in 1978. Wilder, who also developed the RSI and the Average True Range (ATR), aimed to design tools that simplify market analysis while maintaining accuracy.
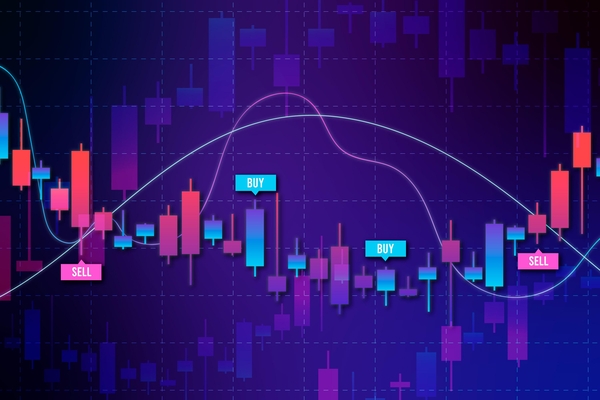
The Parabolic SAR is displayed as a series of small dots above or below the price chart.
When dots appear below price candles, they suggest an uptrend.
When dots appear above, they signal a downtrend.
When the dots switch sides, the indicator suggests that the trend is losing momentum and a reversal may be imminent. Its parabolic shape reflects how price acceleration tends to increase near the end of a move, which is why traders find it especially useful in capturing turning points.
Although trading platforms calculate the Parabolic SAR automatically, understanding the logic behind it helps traders use it better.
The indicator uses three key elements:
SAR (Stop and Reverse value): the previous point on the chart.
EP (Extreme Price): the highest or lowest price of the ongoing trend.
AF (Acceleration Factor): a number that determines how closely the dots follow price.
The formula is:
SARₙ₊₁ = SARₙ + AF × (EP - SARₙ)
Typically, AF starts at 0.02 and increases by 0.02 each time the market makes a new high (in an uptrend) or low (in a downtrend). It is capped at 0.20 to prevent the dots from moving too fast.
This acceleration factor helps the SAR adjust to market speed. When momentum grows, the dots move closer to the price. Once the price touches or crosses them, the indicator flips direction, giving the name "Stop and Reverse."
The Parabolic SAR serves three main functions: identifying trend direction, timing entries and exits, and managing trailing stops.
Trend Identification: When dots stay consistently below price, traders confirm bullish momentum. When they stay above, it signals sustained selling pressure.
Entry and Exit Points: Many traders enter trades when dots switch from one side to the other, as it may indicate an early reversal.
Dynamic Stop-Loss Placement: SAR values can act as a moving stop-loss, automatically adjusting as price moves in a trader’s favour.
In April 2024, EUR/USD rallied from 1.0650 to 1.0930. The Parabolic SAR dots remained below the price during the entire rise, confirming bullish strength. When the dots flipped above 1.0915 after the European Central Bank’s statement, the trend reversed, and EUR/USD quickly retraced to 1.0800.
At the start of 2025, Bitcoin climbed from 58,000 to 67,000 USD. The SAR dots tracked under each daily candle, showing clear upward momentum. After the US Federal Reserve’s hawkish remarks, the dots flipped above price, marking the top of the rally and giving traders an early exit before Bitcoin dropped more than 5 percent.
The Parabolic SAR is powerful but works best when paired with other technical tools that confirm trend strength or market volatility.
With Moving Averages (MA): Filter SAR signals using a 50-period moving average. Only take SAR buy signals when price is above the MA and sell signals when below.
With RSI: Combine the SAR with the Relative Strength Index to validate reversals. For example, if SAR flips bearish while RSI shows overbought conditions, the signal gains credibility.
With ADX: The Average Directional Index helps identify whether a trend is strong enough to act on. If ADX is below 20, SAR signals may be unreliable due to weak trend momentum.
Clear visual representation of trend direction.
Automatically adapts to changing market speed.
Excellent for trailing stop placement in trending markets.
Produces false signals in sideways markets.
Sensitive to volatility; too tight an acceleration factor can cause premature reversals.
Best used with confirmation indicators to avoid whipsaws.
Between January and May 2025, the NASDAQ 100 gained nearly 18 percent, driven by strong earnings from AI-related companies. The Parabolic SAR remained consistently below price throughout the rally. When inflation data in May hinted at potential tightening, the SAR flipped above price, signalling a possible end to the uptrend. Within a week, the index pulled back by about 6 percent.
This real-world example shows how the Parabolic SAR can help traders capture profits during long trends and exit before momentum fades.

Pick Trending Markets: The Parabolic SAR performs best in assets that move strongly in one direction, such as major forex pairs or commodities.
Adjust the Acceleration Factor: The default 0.02 works for most assets, but traders in volatile markets like crypto often use 0.01 for smoother tracking.
Use as a Trailing Stop: Move your stop-loss along with each new SAR point to protect gains without exiting too early.
Confirm Before Acting: Always check for confirmation from volume, moving averages, or price structure before executing trades.
Yes. It is one of the easiest indicators to interpret because its signals are visual and intuitive, making it a good starting tool for new traders.
Yes. It can be applied to forex, commodities, indices, and cryptocurrencies. However, it performs best in trending environments rather than in sideways markets.
It depends on trading style. Intraday traders may prefer 15-minute or hourly charts, while swing traders often use four-hour or daily timeframes for clearer signals.
Mastering the Parabolic SAR is about following momentum rather than predicting it. Markets tend to move in patterns of acceleration and exhaustion, and this indicator helps visualise that transition. Used correctly, it brings structure and discipline to trading, showing when to ride a move and when to step aside.
No indicator is flawless, but the Parabolic SAR remains one of the most enduring because it reflects the psychology of price movement. It captures how traders collectively chase momentum until it slows, and then prepares them for the next phase.
Parabolic SAR: A technical indicator that plots points above or below price to identify trend direction and potential reversals.
Acceleration Factor (AF): A variable that determines how closely the SAR tracks price, increasing as the trend strengthens.
Extreme Price (EP): The highest or lowest value reached during a trend.
Trailing Stop: A dynamic stop-loss that moves with price to secure profits.
Trend Reversal: A point where price shifts direction after a sustained move.
Disclaimer: This material is for general information purposes only and is not intended as (and should not be considered to be) financial, investment or other advice on which reliance should be placed. No opinion given in the material constitutes a recommendation by EBC or the author that any particular investment, security, transaction or investment strategy is suitable for any specific person.