Published on: 2025-08-15
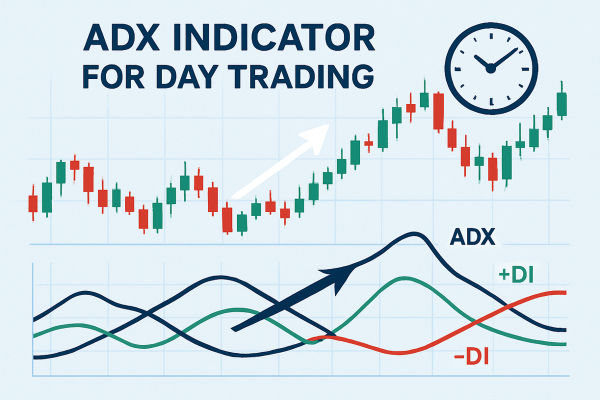
The best way to use the ADX (Average Directional Index) indicator for day trading is to apply it as a filter for strong trends, entering trades only when the ADX reading is above 25 and rising, while confirming direction with the +DI and −DI lines or other trend tools.
This approach helps traders avoid low-volatility, sideways markets and focus on high-probability setups.
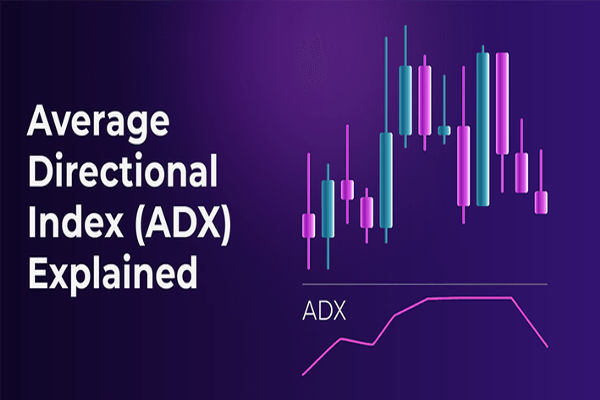
In this guide, we'll break down what the ADX indicator is, how it works, and five proven tips to trade like a pro with it.

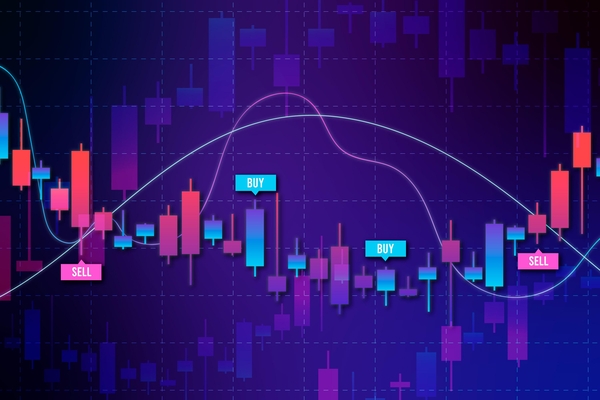
1. Use ADX to Filter Breakouts
A breakout is more likely to succeed when the ADX is already above 25 or rising. If you see a price break through support or resistance with a strong ADX reading, it's usually a higher-probability trade.
Example: If EUR/USD breaks above resistance on a 5-minute chart and ADX rises from 22 to 28, it confirms the strength of the breakout.
2. Combine ADX with Moving Averages
While ADX tells you trend strength, moving averages show direction. Use a 50-period EMA for the main trend and confirm with ADX before entering trades.
Bullish setup: Price above EMA, +DI > −DI, ADX rising above 25.
Bearish setup: Price is below the EMA, −DI is greater than +DI, and the ADX is rising above 25.
3. Spot Trend Exhaustion Early
A declining ADX from elevated levels (e.g., above 40) usually indicates that the trend is weakening. For day traders, this could be a signal to tighten stops or take partial profits before a reversal.
Example: If ADX drops from 42 to 36 while you're in a long trade, it may be wise to scale out.
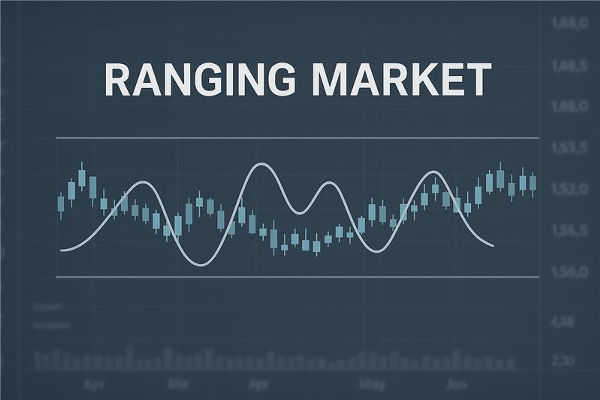
4. Avoid Low-ADX Markets
ADX readings below 20 suggest sideways movement, which can lead to false breakouts. In such cases, switch to range-bound strategies or wait for ADX to rise before trading trends.
Example: On a 15-minute GBP/USD chart, an ADX of 15 means it's better to avoid chasing breakouts.
5. Set Stop-Losses Based on Trend Strength
The stronger the trend (higher ADX), the wider your stop-loss can be to avoid being whipsawed. In weaker trends, implement tighter stops as reversals are more probable.
Example: If ADX is at 35, you could permit a 20-pip stop; if ADX is at 22, a 10-pip stop may be preferable.

Day traders often prefer indicators that work well in short time frames. The ADX fits this requirement because:
It filters out noise in choppy conditions.
It confirms breakout strength before you enter.
It works on multiple time frames from 1-minute to 15-minute charts.
ADX Settings for Day Trading
The typical 14-period ADX is effective for most traders, and day traders might shorten it to 7–10 periods for quicker signals. Shorter intervals provide faster signals but may also lead to increased false alarms, so finding a balance is vital.
How to Read the ADX for Day Trading
When +DI crosses above −DI and ADX is rising, it signals a possible uptrend.
When −DI crosses above +DI and ADX is rising, it signals a possible downtrend.
When ADX is under 20, steer clear of trend-following trades and range strategies.
Example
Time Frame: 5-minute chart.
Indicators: 14-period ADX, 50 EMA.
Entry Rule: Go long when price is above EMA, +DI > −DI, and ADX > 25.
Exit Rule: Take profit at 1.5× risk or when ADX drops below 25.
Stop-Loss: Just below the last swing low.
1. What Is the Best ADX Setting for Day Trading?
The majority of traders opt for the standard 14-period setting for the ADX, as it provides responsiveness and reliability. Shorter periods (e.g., 7) can yield quicker signals but might result in increased false alarms.
2. Can ADX Be Used Alone for Day Trading?
No, the ADX is most effective when combined with moving averages or price action techniques to validate entry and exit signals.
3. Is ADX Better for Trending or Ranging Markets?
ADX works best in trending markets to measure trend strength, not in sideways conditions, where it offers limited insights.
In conclusion, the ADX indicator is a powerful tool for day traders when used correctly. It doesn't predict direction but tells you whether the market is worth trading.
Lastly, integrating ADX with additional indicators and adhering to strict risk management can help eliminate poor trades and concentrate on those with the best chance of success.
Disclaimer: This material is for general information purposes only and is not intended as (and should not be considered to be) financial, investment or other advice on which reliance should be placed. No opinion given in the material constitutes a recommendation by EBC or the author that any particular investment, security, transaction or investment strategy is suitable for any specific person.