In the fast-paced world of financial markets, few approaches are as adaptable or as widely used as momentum trading. Rather than relying on fundamentals or long-term projections, momentum traders focus on the immediate strength and velocity of price movements. It's a strategy that suits nimble thinkers, quick execution, and a data-driven mindset.
For those seeking to harness price surges and capitalise on short-term inefficiencies, mastering momentum techniques is essential. Below, we explore some of the most effective momentum trading strategies in use today — tools that traders employ daily to gain an edge in volatile markets.
Trend Following & Moving-Average Crossovers

At the heart of momentum trading lies the principle of trend continuation — the idea that prices moving strongly in one direction are more likely to keep moving that way in the short term. A widely used tool to identify such trends is the moving average crossover.
Traders often apply short-term exponential moving averages (EMAs), such as the 9-period and 21-period lines, to spot shifts in momentum. When the faster EMA crosses above the slower one, it suggests upward momentum; a bearish crossover implies the opposite. These crossovers can help identify entries during established moves — particularly when confirmed by broader market context or higher time frame alignment.
Intraday traders may also use price-to-MA distance or EMA slope analysis to gauge the momentum's strength. However, moving averages lag by nature, so rapid reversals or range-bound markets can lead to false signals. For this reason, it's crucial to combine them with other tools for confirmation.
Breakout Trading Techniques
Breakouts occur when price pushes beyond a significant support or resistance level with strong momentum. This is one of the most iconic momentum setups and often marks the start of a sharp move.
Common breakout techniques include:
Opening range breakouts (ORB) – using the high and low of the first 15–30 minutes of trading as reference levels.
Flat-top or flat-bottom breakouts – when price consolidates just under a resistance or above a support zone, suggesting pressure build-up.
Breakout with volume spike – indicating genuine institutional interest and increased trader participation.
Momentum traders typically look for volume confirmation, such as 1.5x average volume or high relative volume (RVOL), to validate breakouts. Breakouts without volume often result in false moves or immediate retracements. Aggressive traders may enter just before the breakout (anticipatory entry), while others wait for a candle close above the level (confirmation entry).
Pullback & Retracement Entries
Momentum doesn't always mean chasing price at highs. In fact, seasoned momentum traders often wait for pullbacks or retracements within a trend to secure better entries and manage risk more effectively.
Common pullback techniques include:
Fibonacci retracement levels – especially the 38.2% or 50% zones.
Pullback to the 9 or 20 EMA on intraday charts, used frequently by scalpers and day traders.
Bull flags or bear flags – short consolidation patterns that resolve in the direction of the original move.
Pullback entries give traders a defined risk-reward structure, as stops can be placed just below the consolidation or retracement level. These setups are best when paired with indicators like MACD or RSI, to confirm that momentum is likely to resume.
Oscillator Signals: RSI & MACD
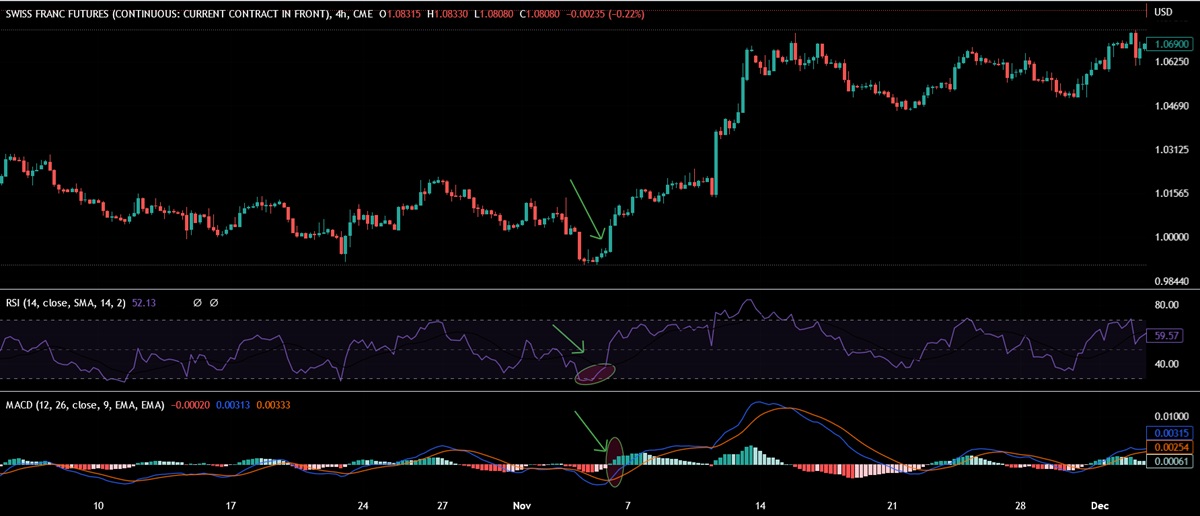
Oscillators help traders determine momentum strength, overbought/oversold conditions, and divergence signals that can anticipate shifts.
Relative Strength Index (RSI): A reading above 70 indicates overbought; below 30 suggests oversold. However, in strong trends, RSI can remain extended for long periods — which in momentum trading is often a continuation signal, not a reversal.
MACD (Moving Average Convergence Divergence): When the MACD line crosses above the signal line, it signals bullish momentum. Many traders use this in tandem with price action to confirm breakout or pullback entries.
Some traders look for RSI divergences — where price makes a new high, but RSI does not — to gauge potential fading momentum. However, in pure momentum trading, these are usually secondary tools rather than primary entry signals.
Volume Confirmation & VWAP Patterns
Volume is one of the most reliable indicators of momentum. A price move backed by increasing volume suggests strong conviction and is more likely to sustain.
Relative Volume (RVOL) compares current volume to the average, with values above 2.0 suggesting strong participation.
VWAP (Volume-Weighted Average Price) is often used by institutional traders as a benchmark. Price above VWAP with rising volume generally signals bullish momentum.
Many intraday traders use VWAP pullbacks to enter trending trades, especially when price pulls back toward VWAP and then resumes upward. It also serves as a mean-reversion tool when price extends far from it during unsustainable moves.
News‑Driven Momentum Trades

Momentum thrives on catalysts — and news events are among the most potent. Whether it's an earnings release, an FDA approval, or a macroeconomic surprise, news-driven spikes can generate explosive price action.
For example:
A biotech firm receiving FDA clearance can spark a multi-day rally.
A surprise interest rate cut can send financial ETFs into a short-term surge.
Even social media chatter or influencer-driven news can push thinly traded stocks into momentum overdrive.
Traders use scanners and newsfeeds to identify such opportunities in real time. However, speed and risk management are critical — news-based trades can turn fast, especially if the broader market rejects the catalyst or if the price action is purely speculative.
Final Thoughts
Momentum trading is not about chasing highs blindly — it's about recognising the right conditions, using tested tools, and maintaining disciplined execution. Whether you're riding breakouts, entering pullbacks, or playing catalyst-driven moves, the key lies in confirming strength, gauging participation, and reacting with clarity.
While the principles are simple, the application is nuanced. Traders must remain flexible, understand context, and continually refine their approach as market conditions evolve. With practice and precision, momentum trading becomes not only a strategy but a mindset — one rooted in speed, structure, and edge.
Disclaimer: This material is for general information purposes only and is not intended as (and should not be considered to be) financial, investment or other advice on which reliance should be placed. No opinion given in the material constitutes a recommendation by EBC or the author that any particular investment, security, transaction or investment strategy is suitable for any specific person.
