The Chande Kroll Stop is a volatility-based indicator that dynamically adjusts stop-loss levels to protect profits while following market trends.
Unlike fixed stops, it evolves with price movement, allowing traders to stay longer in profitable trades without exposing themselves to excessive risk.
This article breaks down its origins, calculation, interpretation, trading strategies, advantages, and best practices so that you can apply the Chande Kroll Stop with confidence and precision in your own trading.
Introduction to the Chande Kroll Stop Indicator
The Chande Kroll Stop was created by Tushar Chande and Stanley Kroll to improve stop management by combining volatility measures with recent price extremes.
It was designed to give traders clear, visually intuitive stop lines that expand and contract with market volatility so that stops sit at statistically relevant distances from price. This makes it useful for trend following, risk management and trailing exits across asset classes.
What the Chande Kroll Stop Is and How It Works
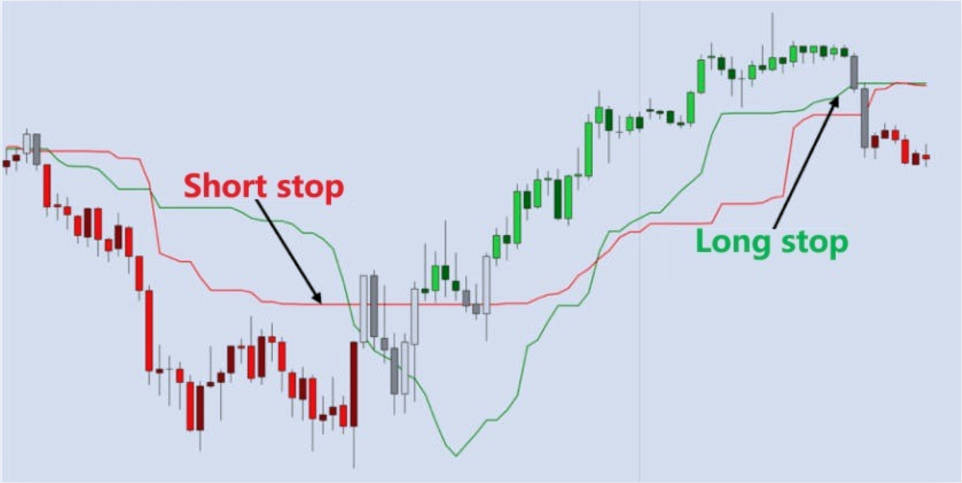
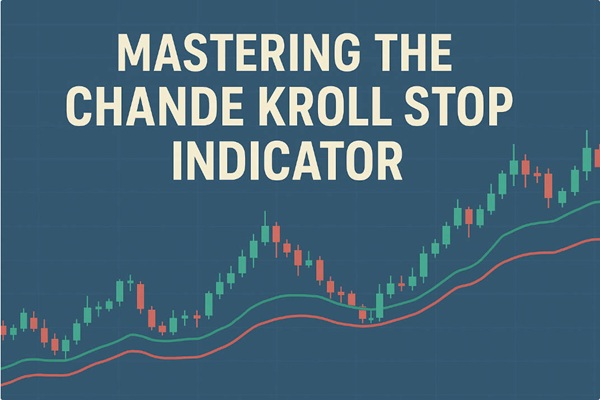
At its core the Chande Kroll Stop overlays two lines on a price chart: a long stop line below price and a short stop line above price. The long stop is formed from the lowest lows over a stop period plus a volatility buffer, and the short stop is formed from the highest highs over the stop period minus a volatility buffer.
These buffers are calculated from the Average True Range so that stops widen in volatile markets and tighten in calm markets. When price crosses both lines in one direction the indicator signals a change of regime.
Calculation and Default Settings of the Chande Kroll Stop
The Chande Kroll Stop uses three principal parameters:
P: ATR period used to compute volatility, commonly 10.
X: ATR multiplier that scales the volatility buffer, commonly 1.
Q: Look-back for updating the stop lines, commonly 9.
Put simply, the indicator computes an ATR, then sets:
The look-back Q governs how the raw stop lines are smoothed and updated, so that the published stop lines reflect recent maxima or minima of the raw lines. Platform implementations can differ slightly in the precise update rule and default numerical values, so traders should check the implementation they use.
Default Parameters and Their Purpose
| Parameter |
Typical Default |
Purpose |
| P (ATR period) |
10 |
Measures volatility over recent bars |
| X (ATR multiplier) |
1 |
Scales the volatility buffer away from price |
| Q (look-back) |
9 |
Controls how stop lines update from highs/lows |
Interpreting the Chande Kroll Stop: Signals and Uses
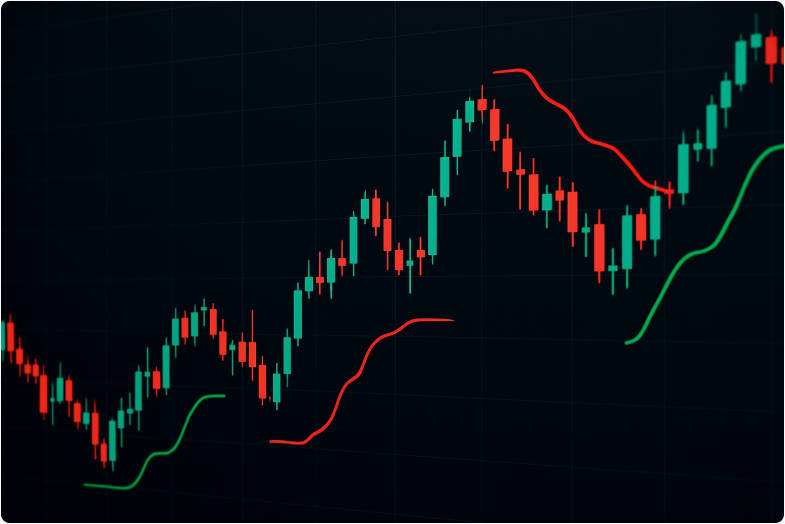
The indicator offers several practical signals:
Entry confirmation:
A closing price that moves above both stop lines suggests a long bias, while a close below both lines suggests a short bias.
Stop-loss placement:
For long positions use the low stop line as the trailing stop. For short positions use the high stop line as the trailing stop.
Trailing exit:
Because the lines update with volatility and extremes, moving the stop to the line allows you to ride trends while letting normal volatility remain tolerated.
Trend identification:
A clear separation between the two lines with price hugging one side indicates a trending market. A narrow band or frequent line crossovers indicate choppy or sideways action.
Traders should treat the indicator as a trailing stop system rather than a pure entry generator. It is often best combined with separate entry signals such as momentum or breakout confirmations.
Strategy Implementation: Applying the Chande Kroll Stop in Practice

When implementing the Chande Kroll Stop consider the following practical points.
1. Choice of Timeframe and Asset
The indicator is applicable to equities, forex, commodities and cryptocurrencies. Shorter timeframes require smaller ATR periods or a reduced multiplier to avoid excessive whipsaws, while longer timeframes can tolerate larger ATR multipliers. Always align P and X to the volatility characteristics of the chosen market.
2. Example Strategy Flows
Confirm trend with a moving average or higher timeframe structure.
Enter on pullback when price remains above the long stop line.
Place initial stop at the low stop line and trail it as price advances.
Parameter Guidance by Timeframe
| Timeframe |
Suggested P |
Suggested X |
Notes |
| Intraday (5–30 min) |
7–10 |
0.7–1.0 |
Use tighter multiplier to reduce lag |
| Daily swing |
10–21 |
1.0–1.5 |
Default settings typically perform well |
| Weekly / Position |
21–50 |
1.5–3.0 |
Wider stops to allow larger swings |
These are starting ranges only. Backtesting on the specific market is essential before live use.
Advantages, Limitations and Trade-Offs

The Chande Kroll Stop offers several advantages:
It places stops in line with recent volatility and price extremes, which reduces arbitrary fixed stops.
It is visually clear and simple to interpret for both long and short trades.
However it has limitations:
In highly choppy markets it can produce false signals and frequent stop-outs because no volatility-based stop prevents whipsaws entirely.
Parameter sensitivity means that poor choices of P, X or Q can make the indicator too tight or too loose for a particular market.
To manage these trade-offs combine the Chande Kroll Stop with a separate entry filter, adjust parameters to the instrument and timeframe, and always conduct robust backtests.
Practical Setup Checklist for Traders
Select the charting platform and add the Chande Kroll Stop indicator. Confirm the platform's implementation details.
Start with common defaults P=10. X=1. Q=9 and observe behaviour on historical data.
Backtest the indicator as a trailing stop in at least three market regimes: trending up, trending down and sideways.
Adjust P and X to balance between being stopped out prematurely and protecting profits.
Integrate position sizing and a discipline for following the trailing stop.
Practical simulation and paper trading will reveal how best to tune the indicator for your style.
Frequently Asked Questions
Q1: What is the primary purpose of the Chande Kroll Stop?
The primary purpose is to provide volatility adjusted stop-loss levels that trail price, allowing traders to protect gains and exit when a trend shows signs of reversal while tolerating appropriate market noise.
Q2: Can I use the Chande Kroll Stop for both long and short trades?
Yes. The indicator displays a low stop for long positions and a high stop for short positions. Traders use the appropriate line as a trailing stop depending on trade direction.
Q3: What parameter values should I use for intraday versus swing trading?
Intraday traders typically reduce ATR period or multiplier to avoid late stops, while swing traders use the default P=10 and X around 1 to 1.5. Always backtest settings on the target timeframe.
Q4: Is the Chande Kroll Stop suitable for all asset classes?
It is broadly applicable to equities, forex, commodities and crypto. Its effectiveness depends on adapting parameters to each asset's volatility and structural behaviour. Backtesting is essential.
Q5: How does the Chande Kroll Stop differ from the Chandelier Exit?
Both use ATR but the Chande Kroll Stop produces two separate stop lines and applies an update/look-back rule that can yield a different sensitivity profile. The Chande Kroll Stop tends to offer more texture in directional reading.
Q6: Why was I stopped out prematurely despite a clear trend?
Premature stop-outs commonly arise from parameter settings that are too tight or from use in choppy markets. Consider widening the ATR multiplier or combining the stop with a trend confirmation filter.
Q7: Should I rely on the Chande Kroll Stop as my sole indicator?
No. It functions best as a stop management tool within a broader framework that includes entry signals, risk control, and position sizing. Use additional confirmations to reduce false signals.
Conclusion
The Chande Kroll Stop is a practical and flexible trailing stop system that adapts to volatility while rooting stops in recent price extremes. It is particularly valuable for traders who wish to protect profits without abandoning a trend prematurely.
However its effectiveness depends on careful parameter selection and sensible combination with entry filters and sound risk management. Traders should paper trade and backtest settings across different regimes before using the indicator with significant capital.
Disclaimer: This material is for general information purposes only and is not intended as (and should not be considered to be) financial, investment or other advice on which reliance should be placed. No opinion given in the material constitutes a recommendation by EBC or the author that any particular investment, security, transaction or investment strategy is suitable for any specific person.
