Published on: 2025-06-13
Updated on: 2026-07-24
A wedge pattern forms when price moves inside two trendlines that converge while sloping in the same direction. A rising wedge slopes upward and usually points to a drop, while a falling wedge slopes downward and usually points to a rise. The pattern looks clean on a chart, and that simplicity is what sets up the mistakes below.
Six errors account for most of the losses on wedge trades, and each one is fixable once you see why it happens. Start with what a wedge actually is, and how often it really does what traders expect.
A wedge has two trendlines that converge while sloping in the same direction. A rising wedge tends to break down, and a falling wedge tends to break up.
Historical pattern studies rank the rising wedge among the less reliable reversal patterns. Its expected downward break happens only around six times in ten, and even then, the move often fails to travel far.
The six mistakes below cover identification, trend context, entry timing, stop placement, volume, and over-reliance on the pattern alone.
The standard price target projects the wedge’s widest height from the breakout point, and it is a working estimate, not a fixed outcome.
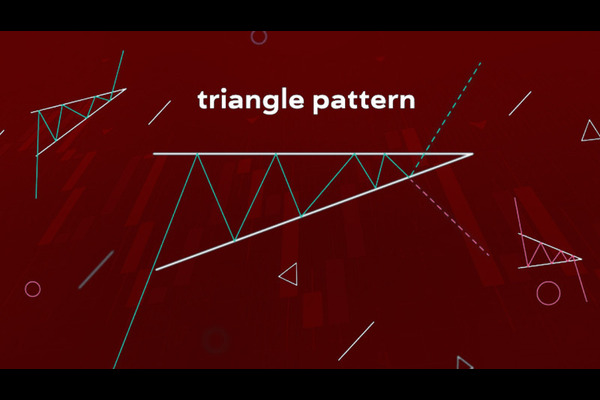
A wedge is a chart formation built from two trendlines that converge as price moves between them. What sets it apart from a symmetrical triangle, where one line slopes up and the other slopes down, is that both wedge trendlines slope the same way. Drawing accurate trendlines matters more for a wedge than for almost any other pattern, because a slightly wrong angle can turn a genuine wedge into a channel on the chart.
There are three types of wedge patterns:
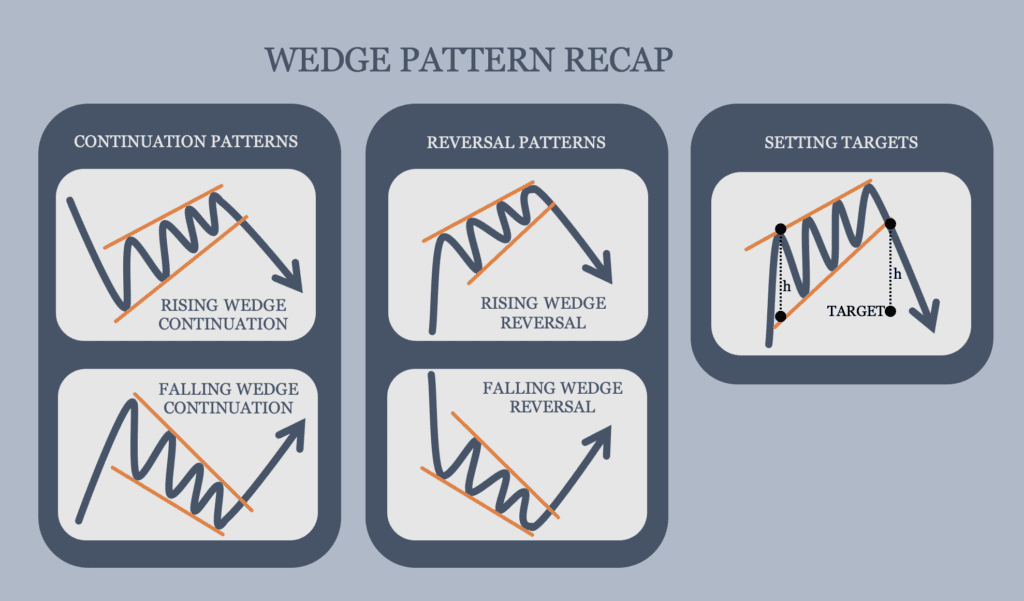
Rising wedge. Both trendlines slope upward, with the lower line rising faster than the upper one. It can form during an uptrend or as a corrective bounce inside a downtrend, and it typically resolves with a break to the downside.
Falling wedge. Both trendlines slope downward, with the upper line falling faster than the lower one. It typically resolves with a break to the upside.
Broadening wedge. Sometimes called a megaphone pattern, its trendlines slope the same way but widen instead of converge. It behaves less predictably than a standard wedge and needs extra caution before you act on it.
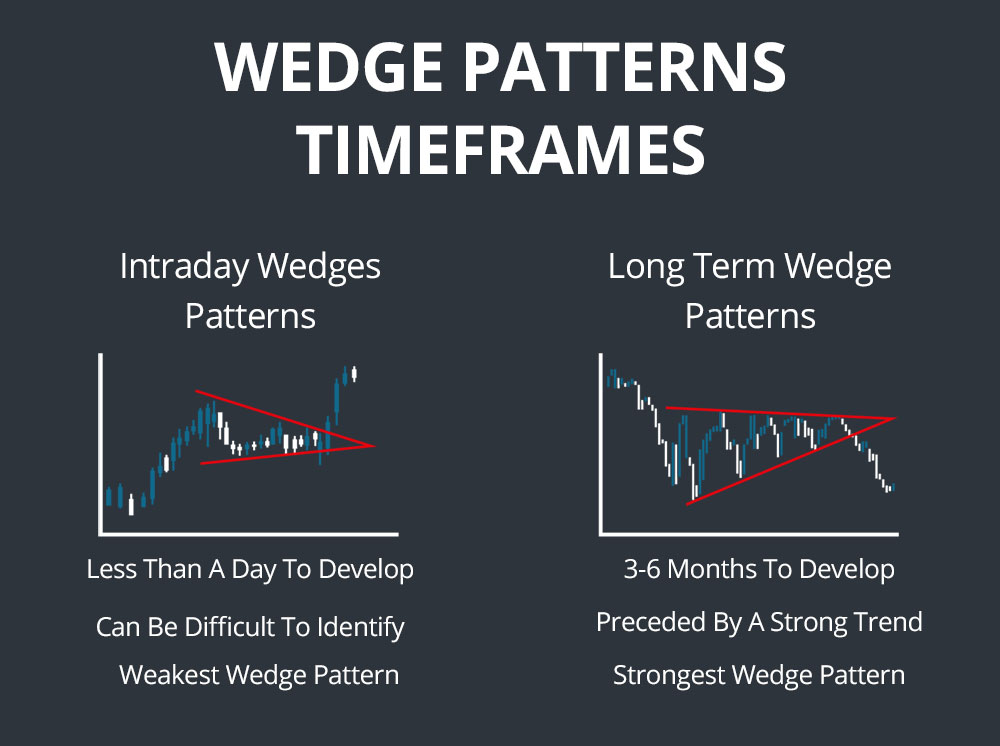
A valid wedge usually takes at least three weeks to form. Anything faster is behaving more like a short continuation pattern, and traders who call a two-day formation a wedge are usually setting up the first mistake on this list.
“Horizontal wedge” is not a standard chart pattern, because a true wedge always slopes up or down. Traders who search for the term are usually describing one of two things: a rectangle, where price bounces between roughly flat support and resistance, or a symmetrical triangle, where one line slopes up and the other slopes down toward a fairly level midpoint. Neither behaves like a wedge, and mistaking a rectangle for one is a fast way to misread which way the breakout should favour.
Traders often treat the wedge as a high-probability setup. It is popular, but its real track record is weaker than its reputation suggests, and knowing that changes how you size and manage the trade.
In Thomas Bulkowski’s long-running statistical study of chart patterns, the rising wedge ranked among the weaker performers for its expected downward break: the break went downward only around six times in ten, and even then, the move failed to clear a meaningful distance in roughly half of those cases. The falling wedge performed somewhat better for its expected upward break, which came a little more than two times in three, with a break-even failure rate closer to one in four.
None of this makes the wedge pattern useless. A setup with a 60% to 68% directional edge and a defined stop and target is still workable, as long as position size and confirmation account for the failure rate that comes with it. Mistake six below covers exactly that gap.
The wedge is easy to confuse with four other patterns. The table below separates them by the two features that matter most: whether the trendlines converge, and whether the pattern needs a sharp prior move, known as a flagpole, to be valid.
Pattern |
Trendline slope |
Converge or stay parallel |
Typical duration |
Needs a flagpole? |
|---|---|---|---|---|
Wedge (rising or falling) |
Both lines slope the same direction |
Converge |
3 weeks or more |
No |
Symmetrical triangle |
One line up, one line down |
Converge |
Several weeks |
No |
Pennant |
One line up, one line down, narrow |
Converge |
Under 3 weeks |
Yes |
Flag |
Both lines slope against the prior move |
Stay roughly parallel |
1 to 4 weeks |
Yes |
Channel |
Both lines slope the same direction |
Stay parallel |
Any length |
No |
A so-called flag or pennant that runs for three weeks or longer usually is not one. At that point, check whether the trendlines converge, which points to a wedge, or stay parallel, which points to a channel.
A wedge, a symmetrical triangle and a channel can look almost identical on a fast-moving chart. The giveaway is the slope: in a wedge, both trendlines slope in the same direction and converge. In a channel, they run parallel. In a symmetrical triangle, one line slopes up while the other slopes down.
Traders who skip this check sometimes trade a channel breakout as if it were a wedge breakout, and end up on the wrong side of the move. Redraw both trendlines before naming the pattern, using the same swing highs and lows each time rather than adjusting them to fit a preferred outcome.
A rising wedge is a bearish pattern even while price is still rising, and a falling wedge is bullish even while price is still falling. That runs against instinct, which is why the wedge needs the surrounding trend as context.
A falling wedge that forms as a brief pause after a long uptrend carries different weight than one forming after a multi-month decline. Add the numbers from the reliability section above: the rising wedge’s expected downward break happens only around six times in ten. Trade the pattern in isolation, without checking where it sits in the broader trend, and that uncertainty only grows.
Price often pushes against a wedge trendline several times before it actually breaks. Traders who enter on the third or fourth touch, expecting an immediate break, are often stopped out by another move in the old direction before the real breakout arrives. A confirmed break needs a candle that closes clearly beyond the trendline, ideally on the volume increase described below.
The strongest breakouts also tend to come well before the wedge reaches its apex, roughly two-thirds to three-quarters of the way through the pattern. A break right at the apex, where the trendlines are about to meet, is more often a weak, low-momentum move than a genuine signal. Waiting for a confirmed break and retest costs a small part of the move but removes most of the false starts.
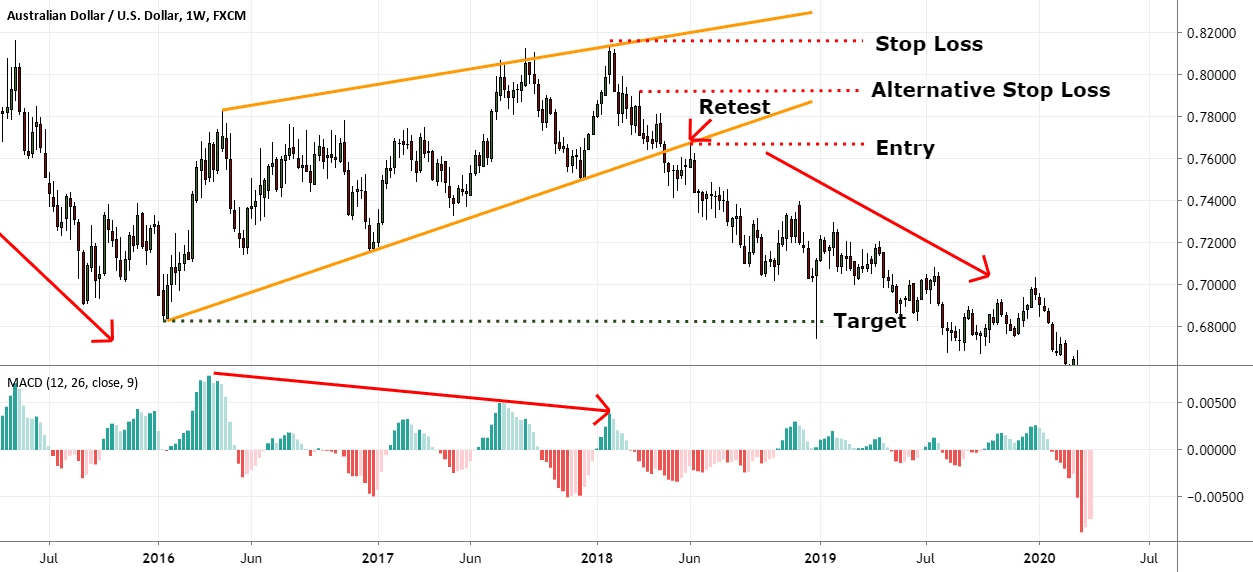
A wedge breakout rarely moves in a straight line. Price commonly returns to retest the broken trendline before continuing, a normal move known as a throwback on an upside break or a pullback on a downside break, and historical data puts it in roughly two-thirds to three-quarters of all wedge breakouts.
A stop placed just beyond the trendline gets hit during that retest even when the original trade idea was right. Set the stop beyond the next real support or resistance level, not a few pips or points past the trendline, and the position has enough room to survive the retest.
Volume tends to fall as a wedge forms and rise sharply once it breaks. A break on falling or flat volume is a weaker signal and fails more often than one backed by a genuine increase. Traders who watch only price and skip volume miss the warning and end up holding a position through a false break.
A wedge on its own says nothing about momentum, nearby support and resistance, or scheduled news. Check it against a tool such as RSI, MACD, or a clear support or resistance zone, and the reading either strengthens the signal or contradicts it. A contradiction is useful too, because it flags a setup worth skipping rather than forcing.
The standard method projects the pattern’s own height onto the breakout. Measure the vertical distance between the two trendlines at the widest point of the wedge, usually near where the pattern began. Then add that distance to the breakout price for a falling wedge, or subtract it for a rising wedge, to get a working target.
Treat this figure as a guide, not a guarantee. Even in Bulkowski’s data, the projected target is reached a little under two-thirds of the time after an upward break, and closer to one time in three after a downward break. Many traders manage part of the position at a nearer level, such as the previous swing high or low, and let the remainder work toward the full measured target.
Despite the mistakes above, the wedge pattern has stayed popular for two simple reasons: it appears on every timeframe and instrument, from a five-minute forex chart to a weekly index chart, and it marks a clear point to set both a stop and a target. That popularity does not make the pattern accurate by itself. It makes the pattern easy to use correctly once the six mistakes above are addressed, and easy to misuse when they are not. Traders who mark up wedges on a charting platform still need to run the same trend, volume, and confirmation checks by hand.
It depends on the type. A rising wedge is generally bearish and points to a downward break, while a falling wedge is generally bullish and points to an upward break. Neither direction is guaranteed, which is why confirmation and stop placement matter more than the pattern’s label.
No. A rising wedge carries a bearish bias, but historical data shows the downward break happens only around six times in ten. The reverse is common enough that waiting for confirmation beats assuming the bearish outcome.
There is no standard pattern by this name. Traders who search for it are usually describing a rectangle, with flat support and resistance, or a symmetrical triangle, with one rising and one falling line. Both behave differently from a true wedge, where both trendlines slope the same way.
Most technical analysts look for at least three weeks of price action. Anything faster is more likely a flag or pennant, which follow different rules for volume and duration.
In a wedge, both trendlines slope the same way and converge. In a symmetrical triangle, one line slopes up while the other slopes down, and the overall shape is closer to horizontal.
Less reliable than its reputation suggests. Historical studies rank the rising wedge among the weaker reversal patterns for its expected downward break, while the falling wedge performs somewhat better for its expected upward break. Reliability improves when you combine the pattern with trend context, volume confirmation, and a defined stop.
The wedge rewards patience more than any other single skill. Waiting for a confirmed close beyond the trendline, checking volume, and setting the stop beyond the next real support or resistance level fixes four of the six mistakes on this list on its own.
The other two, misidentifying the pattern and trading it alone, come down to pausing before you enter: redraw the trendlines, check what the pattern actually predicts against the wider trend, and treat the projected target as a working estimate rather than a fixed outcome. Traders who build that habit tend to lose less on the wedge’s frequent false breaks, which matters more to long-run results than catching every clean one.
Disclaimer: This material is for general information purposes only and is not intended as (and should not be considered to be) financial, investment or other advice on which reliance should be placed. No opinion given in the material constitutes a recommendation by EBC or the author that any particular investment, security, transaction or investment strategy is suitable for any specific person.