Published on: 2025-05-20
Updated on: 2025-05-20
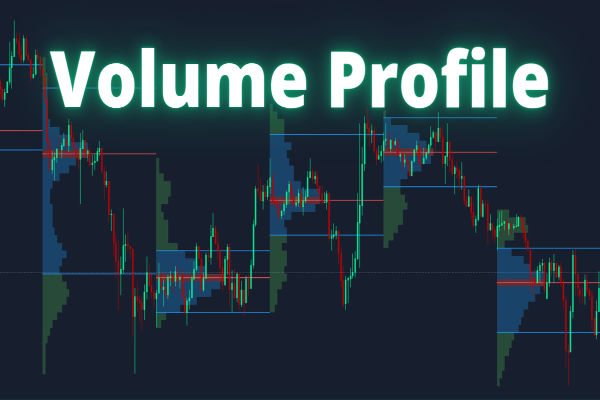
Volume profile is a market analysis tool that displays the distribution of trading volume across different price levels over a specified period. Unlike traditional volume analysis, which shows total volume for each time period, volume profile offers a more detailed view by showing where volume occurred at specific price levels.
This indicator provides traders with crucial insights into market structure and potential areas of support or resistance. By focusing on where trading activity has been concentrated, volume profile helps identify the levels at which buyers and sellers are most active. It's a key tool for traders who want to understand the underlying market dynamics.

Understanding the basic components of volume profile is essential for effectively using it in your trading. The horizontal axis of the profile represents price levels, while the vertical axis shows the volume traded at each of these levels. A key feature of volume profile is the Value Area (VA), which indicates the range of prices where most trading volume has occurred. This is often where price is likely to find support or resistance.
Another important element is the Point of Control (POC), which is the price level where the highest trading volume has occurred. The POC is considered the most significant price level, as it often serves as a key reference point for traders.
Volume profile offers several advantages over traditional volume indicators. One of the key benefits is its ability to pinpoint areas of high trading activity that could act as support or resistance. By identifying these levels, traders can make more informed decisions about entry and exit points. Volume profile also helps in understanding market structure, making it easier to determine whether the market is trending or consolidating.
Moreover, volume profile is particularly useful for spotting areas where institutional traders are active. Large-volume nodes often indicate where big players have placed their orders, which can give traders insights into market moves. This allows traders to better time their trades by focusing on levels with significant market interest.
Despite its effectiveness, volume profile can be misunderstood by many traders. One common misconception is that volume profile is the same as traditional volume indicators. While traditional volume shows the total amount of trades over a specific period, volume profile breaks this down into price levels, offering a more detailed picture of where most trading has occurred. This provides traders with a clearer understanding of market structure and price action.
Another myth is that volume profile can predict exact price movements. While volume profile identifies important price levels, it does not forecast precise price direction. It shows where trading interest has been concentrated, which can help predict support or resistance zones, but it should always be used alongside other indicators to confirm potential market moves.
Lastly, many believe that volume profile is only for advanced traders. In reality, once you understand the basic principles, it's a straightforward tool that can benefit traders of all experience levels. Beginners can start by focusing on key support and resistance levels before incorporating more advanced strategies.

Incorporating volume profile into your trading strategy requires a thoughtful approach. The first step is identifying key levels of support and resistance, which volume profile helps to highlight. When a price level has a significant concentration of volume, it suggests that traders see it as an important level. These high-volume nodes are often areas where price will either find support or face resistance.
Next, it's important to keep an eye on the Point of Control (POC), which is the price level where the most volume has occurred. The POC serves as a reference point, and price often gravitates towards it before continuing its move. If price is trending above the POC, it suggests a bullish market, while a trend below the POC suggests a bearish market. This can help you gauge the overall market sentiment and adjust your trades accordingly.
Another way to use volume profile is to combine it with other indicators to strengthen your trading decisions. For example, RSI can help confirm whether the market is overbought or oversold at a certain price level, while MACD can provide confirmation of trends and momentum. These indicators work well alongside volume profile, helping you make more accurate predictions about price action.
Consider a trader analysing a stock that has recently entered a consolidation phase. By using the volume profile, they can identify that there is a significant high-volume node at £150, with the POC sitting at £155. The trader notices that price is hovering near £150, the lower end of the value area. Given the concentration of volume at this level, the trader may expect the price to bounce upwards towards the POC or higher if the market sentiment is bullish.
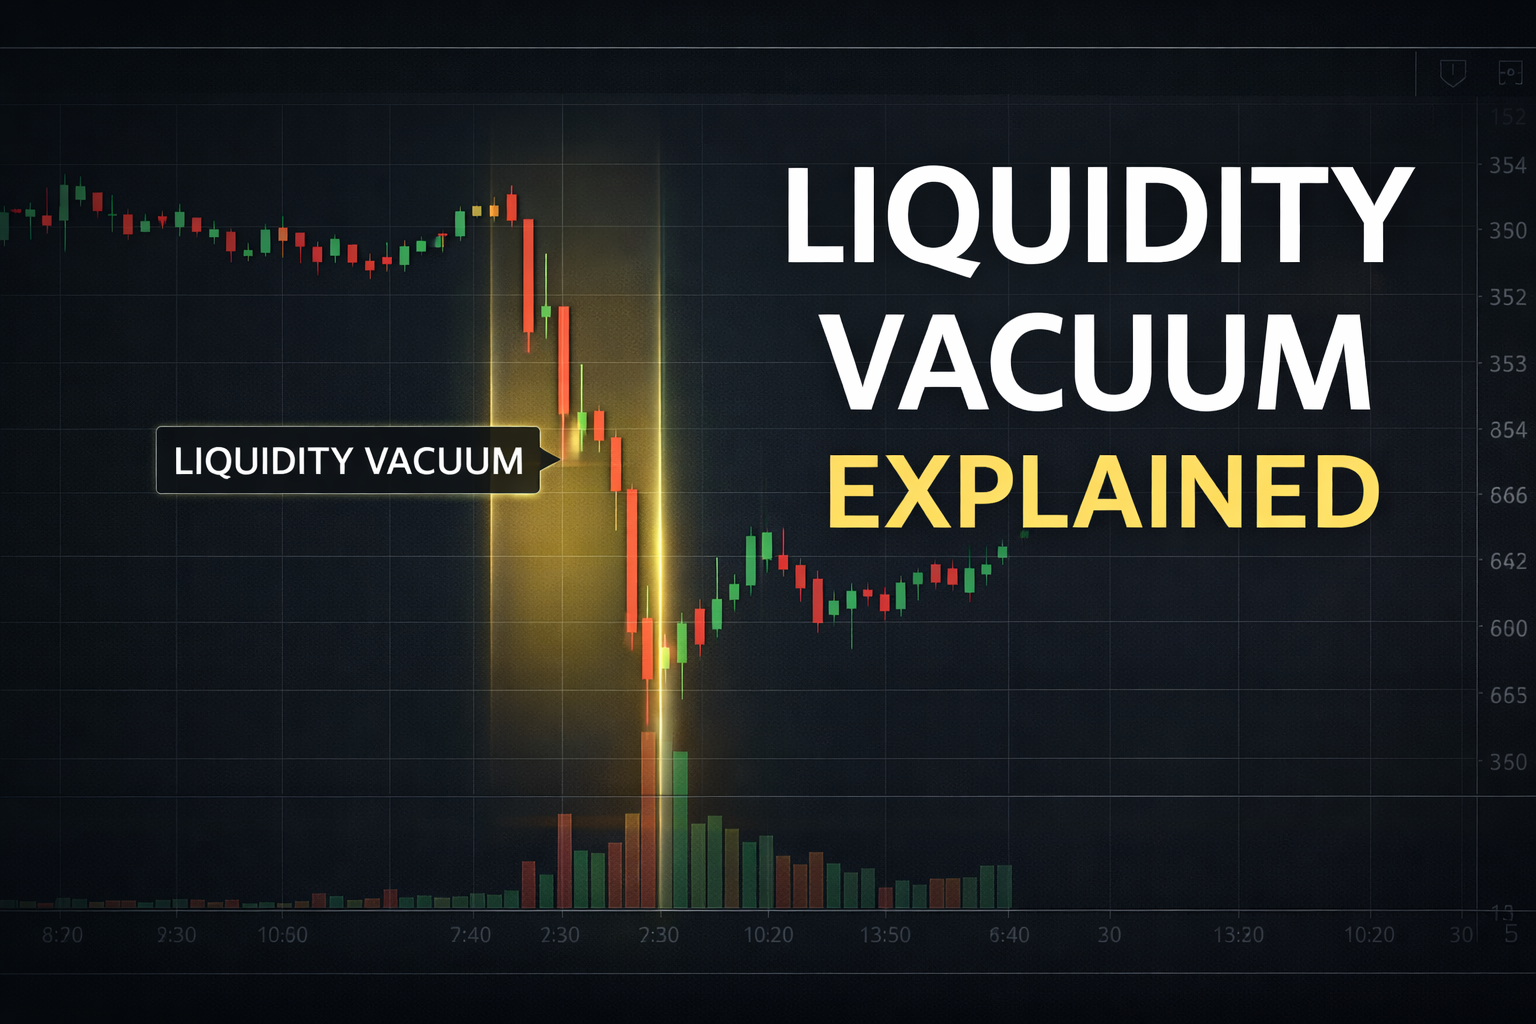
Conversely, if price breaks below £150 and volume profile shows little interest below this level, the trader might anticipate a continued downward move, as this low-volume zone could act as a price "gap." This allows the trader to plan their entries and exits more effectively.
Volume profile is a powerful tool for traders looking to gain a deeper understanding of market structure and potential support and resistance levels. By analysing where volume has been concentrated at specific price points, traders can identify key levels for entering or exiting trades.
Though it may seem complex at first, volume profile is an essential tool for traders of all experience levels. By using it alongside other indicators, you can enhance your decision-making and improve your trading outcomes. Remember, the key is to understand the volume distribution and how it reflects market sentiment, rather than relying solely on the tool to predict precise price movements.
Disclaimer: This material is for general information purposes only and is not intended as (and should not be considered to be) financial, investment or other advice on which reliance should be placed. No opinion given in the material constitutes a recommendation by EBC or the author that any particular investment, security, transaction or investment strategy is suitable for any specific person.