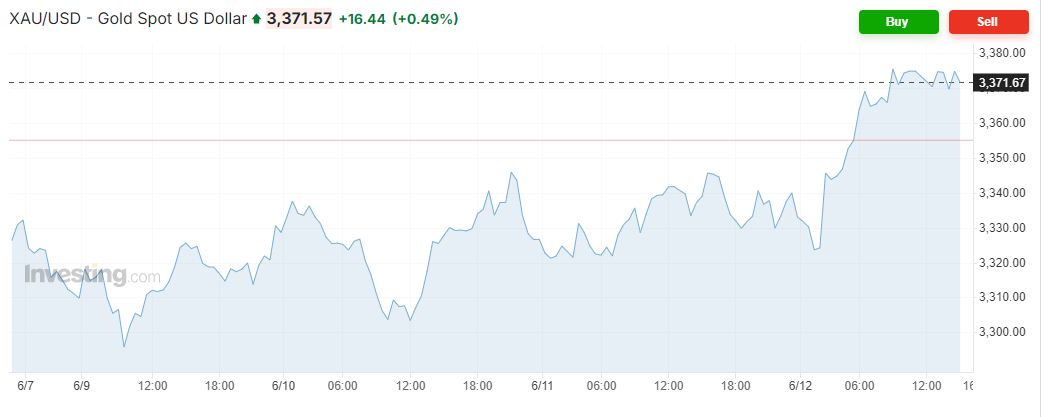
Gold (XAU/USD) has remained a focal point for traders in 2025. driven by shifting inflation expectations, central bank moves, and global uncertainty. While fundamental narratives often dominate headlines, technical analysis continues to offer crucial insight into price direction. From key chart formations to momentum indicators and support-resistance levels, a detailed technical approach helps clarify what may lie ahead for gold in the coming weeks.

A cornerstone of technical forecasting is the identification of major price zones. Recent charts highlight a well-defined consolidation range between $3.290 and $3.375. with intermittent resistance around $3.360 and minor support just above $3.310. These levels have been repeatedly tested in recent sessions, indicating their importance to both bulls and bears.
Classic patterns such as double tops and bullish flags have appeared around these price areas. For instance, the price flirted with a double top formation near the $3.375 mark—a level that now serves as a significant resistance ceiling. On the downside, $3.290 has emerged as a dependable support, stemming from multiple failed breakdowns. Should price close below this level on high volume, the next leg down could accelerate quickly.
Moving Averages & Momentum Indicators

Moving averages remain reliable tools for assessing trend direction. The 50-day and 200-day simple moving averages (SMA) are particularly relevant in the current gold setup. At present, XAU/USD is trading above both, indicating a sustained bullish bias over the medium to long term. The 20-day exponential moving average (EMA), meanwhile, is tracking closely with recent pullbacks, serving as dynamic support.
Momentum indicators are offering mixed signals. The Relative Strength Index (RSI) has hovered near 60–70 in recent weeks, suggesting strength but also nearing overbought conditions. The Stochastic Oscillator has shown a series of crossovers in the overbought zone, hinting at short-term fatigue. Still, unless we see divergence or a breakdown in price, these are likely part of a healthy bullish trend rather than a sign of reversal.
Breakout vs Consolidation Scenarios
Gold is currently oscillating between a breakout attempt and a consolidative phase. Following a strong upward thrust earlier this quarter, the market has paused just below the key resistance at $3.375. This forms the upper band of a potential ascending triangle—a pattern typically associated with bullish continuation.
If price breaks and closes above $3.375 with increased volume, it may trigger momentum buying and take XAU/USD towards the $3.430–$3.450 zone. On the other hand, if the breakout fails and price is rejected, we could see a retest of the $3.300–$3.290 support zone. This would not necessarily indicate trend reversal but might confirm consolidation ahead of further upward movement.
In this range-bound context, high-impact events such as U.S. CPI releases or Federal Reserve commentary could act as catalysts for a decisive move.
Wyckoff Structure & Elliott Wave
Applying Wyckoff's methodology reveals that XAU/USD may currently be in the late stages of accumulation or early stages of a markup phase. After a period of consolidation near the $3.290–$3.310 area, the price has gradually begun printing higher lows, a hallmark of institutional accumulation. The rally from this base could represent the start of a Phase D advance, moving towards a supply zone around $3.375.
Meanwhile, Elliott Wave theorists might label the latest push as Wave 3 of a five-wave upward sequence, often the strongest in terms of price movement. Wave 2 found support at $3.290. and the projected termination of Wave 3 could reach up to $3.430 before a corrective Wave 4 retraces towards $3.350–$3.360.
Both frameworks support a constructive outlook, provided the market avoids a breakdown below $3.290. which would negate the current wave count or disrupt the Wyckoff structure.
Intraday & Swing Trade Levels
For those trading on shorter timeframes, key intraday levels have emerged. On the upside, the $3.331–$3.340 zone has acted as a magnet for price action, often marking minor reversals or continuation pivots. A clean break above this level could offer a short-term push toward $3.360. which might then open the way to $3.375.
On the downside, swing traders are watching $3.321 and $3.310 as initial supports. Below these, $3.290 is the critical level that separates bullish continuation from a possible deeper retracement.
Volume profile analysis also indicates high activity zones around $3.335. suggesting strong institutional interest and possible re-entry points for long positions. Traders are advised to pair these zones with oscillator confirmation before entering positions.
Final Thoughts
In 2025. XAU/USD remains in a technically strong position, with price supported by key moving averages and constructive chart patterns. While momentum indicators hint at caution in the short term, the broader trend appears intact, and consolidation above $3.290 suggests further upside potential. Whether trading intraday, swing, or holding longer-term positions, a technical approach rooted in levels, indicators, and price structure offers clarity in an otherwise volatile market.
Disclaimer: This material is for general information purposes only and is not intended as (and should not be considered to be) financial, investment or other advice on which reliance should be placed. No opinion given in the material constitutes a recommendation by EBC or the author that any particular investment, security, transaction or investment strategy is suitable for any specific person.


