Published on: 2023-06-28
Updated on: 2024-07-05
Understanding Moving Average Indicators
The moving average, abbreviated as MA, is an indicator that reflects changes in the trend of indices and Stock Prices. The moving average analysis method was founded by American investment expert Granville and evolved from the "three trends theory" of Dow's stock price analysis theory. It moves the closing price of the last N days to obtain the N-day moving average, which serves as a tool for evaluating stock price trends.

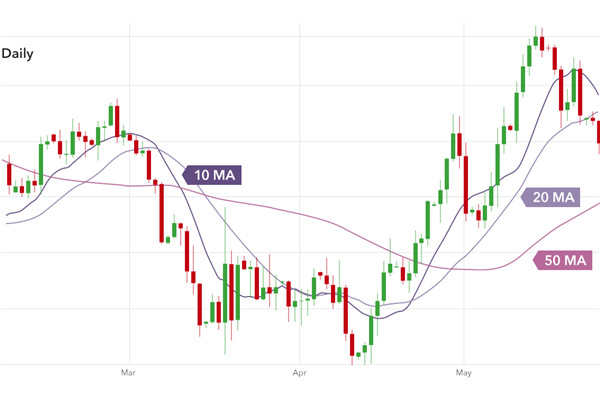
MA Indicator
In general, moving averages can be divided into the following types: simple moving averages, exponential moving averages, unobstructed moving averages, and linear weighted moving averages. In fact, investors can perform a moving average on any column of data, including opening and closing prices, highest and lowest prices, trading volume, etc.
In fact, if classified according to the standard of time length, the moving average can be divided into short-term, medium-term, and long-term moving averages: the 5-day and 10-day moving averages are often defined as short-term moving averages; the 20-day and 30-day moving averages are defined as medium-term moving averages; the 60-day moving averages are defined as medium- and long-term moving averages; and the 120-day and 250-day moving averages are defined as long-term moving averages. Generally speaking. Due to the close proximity of the 5-day moving average to the actual price level, it is difficult to reveal the trend of changes in variables. Therefore, it is necessary to use it in conjunction with the 10-day moving average as an effective discriminant signal for short-term behavior. The 20-day moving average can be used as the basis for making mid-term investment decisions. The 30-day moving average is mainly used for combining analysis with short-term lines to determine whether the trend is rebounding or reversing. The 60-day moving average is more reliable in understanding medium- to long-term acquisition costs, revealing regular fluctuations in the medium- to long-term, correcting short-term randomness and deception (commonly known as deception lines), and making up for the lack of slow reflection of long-term lines. The 120-day and 250-day moving averages are highly reliable for predicting economic trends within a year and are one of the investment decision-making tools for institutions. Among them, the 250-day long-term moving average is the boundary between a bull market and a bear market.
Characteristics of Moving Average (MA)
1. Trend Judgment
The moving average indicator can help investors judge market trends. By calculating the average price over a certain period of time, the trend of price changes can be observed. When the price is above the moving average, it indicates that the market is in an upward trend. When the price is below the moving average, it indicates that the market is in a downward trend.
2. Support and Resistance
The moving average indicator can provide a reference for support and resistance. When prices fall near the moving average, the moving average may become a support, suppressing the continued decline of prices. When prices rise near the moving average, the moving average may become resistance, suppressing further price increases.
3. Cross Signal
The cross signal of the moving average indicator can be used to determine the buying and selling timing. When the moving average of a shorter period of time crosses the moving average of a longer period of time from the bottom, it is called a "golden cross", which may indicate an upward trend in prices and can be considered for buying; When the moving average of a shorter period of time crosses the moving average of a longer period of time from top to bottom, it is called a "dead cross" and may indicate a downward trend in prices. Therefore, selling can be considered.
4. Smoothing Price Fluctuations
The moving average indicator can smooth out price fluctuations, making the trend more clear. By calculating the average price, short-term fluctuations in prices can be weakened, making it easier for investors to observe changes in long-term trends.
5. Relative Lag
The moving average indicator is a lagging indicator that is calculated based on past price data. Therefore, the moving average indicator may lag behind the actual price changes, leading to a delay in buying and selling opportunities. Investors need to conduct comprehensive analysis based on other indicators and market conditions to reduce the adverse effects of lag.
Different moving average indicators have different characteristics, such as simple moving average (SMA), exponential moving average (EMA), and weighted moving average (WMA). Investors should choose suitable moving average indicators based on their trading strategies and market conditions and conduct comprehensive analysis in conjunction with other technical indicators.


World's Best Broker