Published on: 2025-06-11
Updated on: 2025-11-14
Markets move in patterns. By reading higher highs and lower lows, traders can gauge trend strength, anticipate reversals, and time entries and exits with precision.
These up-down patterns are not just simple markings on a chart, they reveal the underlying market sentiment, help traders identify trends, anticipate reversals, and time entries and exits with greater precision.
In this guide, we’ll break down how to recognize higher high and lower low patterns, explain their significance in forex, stocks, and crypto markets, and show practical strategies to use them for smarter, more profitable trades.
Whether you’re a beginner or an experienced trader, mastering these formations can give you a crucial edge in today’s volatile markets.

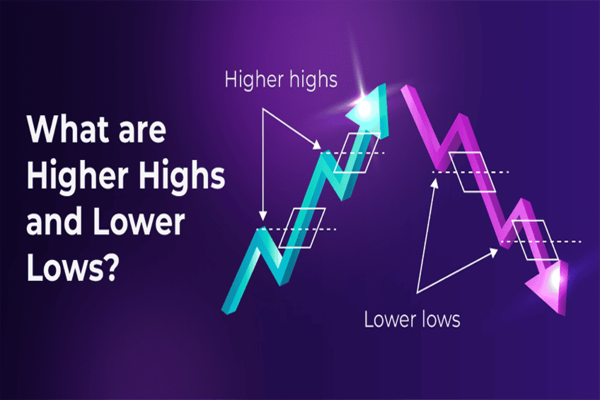
In technical analysis, a "high" is the peak a price reaches before pulling back, while a "low" is the trough before the price moves up again.
The sequence of these highs and lows forms the backbone of market structure, allowing traders to gauge whether bulls (buyers) or bears (sellers) are in control.
A "higher high" occurs when the price reaches a new peak that surpasses the previous high. This pattern signals that buyers are willing to pay more, reflecting strong bullish momentum.
When a series of higher highs is accompanied by higher lows (each low higher than the previous), it confirms an uptrend.
Why it matters to traders:
Trend confirmation: Multiple higher highs and higher lows show a market in a sustained uptrend, ideal for buying opportunities.
Entry signals: Traders often enter long positions after a pullback to a higher low, anticipating the next higher high.
A "lower low" forms when the price drops to a new trough below the previous low. This pattern is a clear sign of bearish sentiment, as sellers drive the price lower. A series of lower lows, especially when paired with lower highs, confirms a downtrend.
Why it matters to traders:
Bearish market structure: Persistent lower lows and lower highs indicate strong selling pressure, favouring short-selling strategies.
Exit or entry points: Traders may exit long positions or enter shorts when a lower high is followed by a fresh lower low.
| Feature | Higher High (HH) | Lower Low (LL) |
|---|---|---|
| Definition | A peak that surpasses the previous high | A trough that falls below the previous low |
| Market Sentiment | Bullish; buyers are in control | Bearish; sellers are in control |
| Trend Indication | Uptrend | Downtrend |
| Accompanied Pattern | Often paired with higher lows | Often paired with lower highs |
| Trading Opportunity | Enter long positions on pullbacks | Enter short positions on rallies |
| Risk Management | Stop-loss below the last higher low | Stop-loss above the last lower high |
| Example | Price moves from $100 → $105 → $108 | Price moves from $108 → $105 → $102 |
While higher highs and higher lows indicate an uptrend, and lower lows and lower highs signal a downtrend, transitions between these patterns often mark trend reversals.
From uptrend to downtrend: If a market fails to make a new higher high and instead forms a lower low, it suggests the uptrend is weakening and a reversal could be imminent.
From downtrend to uptrend: Conversely, when a market stops making lower lows and instead forms a higher high, it may signal the start of a new uptrend.
Identifying these shifts early can help traders enter or exit positions at optimal moments.
1. Identifying Entry and Exit Points
In an uptrend, entering after a pullback to a higher low can provide a favourable risk-reward setup.
In a downtrend, entering short after a lower high can maximise profit potential as the next lower low forms.
2. Risk Management
Place stop-loss orders below the latest higher low in an uptrend to limit downside.
In a downtrend, stops can be set above the most recent lower high.
3. Confirming Breakouts and Reversals
A breakout above a prior high forming a new higher high can confirm the start of a bullish move.
Failure to form a higher high or lower low may signal a weakening trend and possible reversal.

Experienced traders often combine higher high and lower low analysis with other tools:
Trendlines: Drawing lines connecting successive highs or lows clarifies trend direction.
Volume: Increasing volume on a higher high or lower low strengthens the signal.
Indicators: Tools like RSI, MACD, or moving averages can validate trend strength or reveal divergence.
Use these indicators to validate the market structure before entering trades. A higher high accompanied by strong volume, RSI confirmation, and trendline alignment is far more reliable than relying on price alone.
Timeframes matter:
Day traders may use these patterns on 1-minute or 5-minute charts for rapid trades.
Swing traders and investors often focus on hourly, daily, or weekly charts for broader trends.
Tip: Combining multiple timeframes such as confirming a daily trend with a 15-minute intraday chart can improve trade accuracy and timing.
Imagine a stock moves from $100 to $110 (first high), pulls back to $105 (first low), then rallies to $115 (higher high), and drops to $108 (higher low). This sequence signals an uptrend, and a trader might buy at $108, expecting another higher high.
If the stock then falls to $102 (lower low), it could indicate a trend reversal, prompting the trader to reconsider their position.
A higher high exceeds the previous peak, signaling bullish momentum. A lower high fails to surpass the previous peak, indicating weakening buyers and potential downtrend.
Yes. These patterns apply to forex, stocks, crypto, commodities, and indices as they reflect market structure and trader behavior universally.
Look for reversal candles, wicks, low volume, or failure to sustain above resistance. Combining with indicators like RSI or MACD can confirm if momentum is real.
It depends on your strategy. Day traders may use 1–15 minute charts, while swing traders or investors often use 1-hour, 4-hour, daily, or weekly charts for more reliable signals.
The higher high and lower low patterns are foundational tools for traders across all markets. By recognising these formations, traders can better identify trends, anticipate reversals, and refine their entry and exit strategies.
Whether you are a day trader or a long-term investor, mastering these patterns will enhance your technical analysis and support more informed trading decisions.
Disclaimer: This material is for general information purposes only and is not intended as (and should not be considered to be) financial, investment or other advice on which reliance should be placed. No opinion given in the material constitutes a recommendation by EBC or the author that any particular investment, security, transaction or investment strategy is suitable for any specific person.