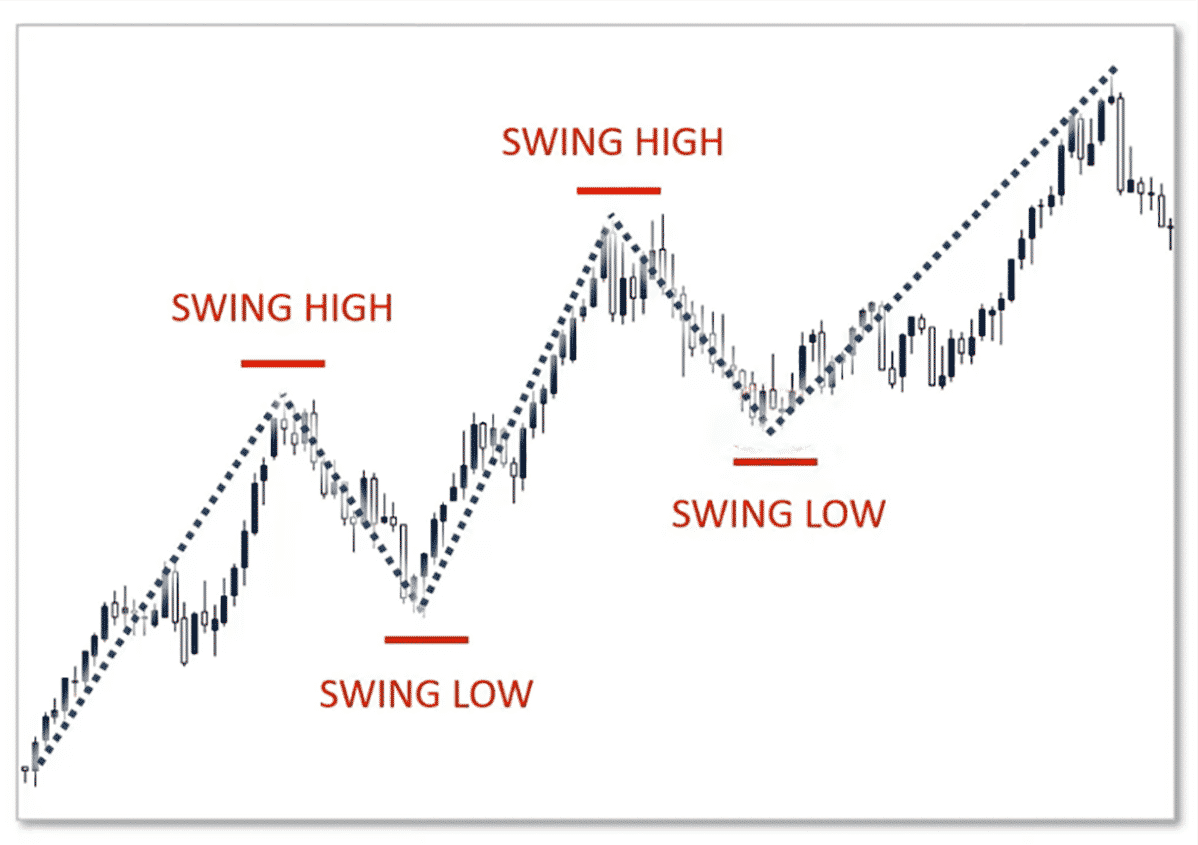
Swing trading remains popular for traders aiming to capitalise on short and medium-term price movements. By holding positions for several days to weeks, swing traders seek to profit from market "swings" using various strategies.
In 2025, various strategies have proven effective by leveraging technical analysis, market patterns, and disciplined execution.
Below are ten swing trading strategies that we recommend in current market conditions.
Ranking the 10 Best Swing Trading Strategies

1) Trend Following
Trend following involves identifying and trading in the direction of the prevailing market trend. Traders use tools like moving averages to confirm trends and determine entry and exit points.
For instance, a typical method is to enter a trade when the price crosses above the 50-day moving average, signalling an uptrend, and exit when it falls below. This strategy capitalises on the market's momentum, aiming to ride trends until signs of reversal appear.
Sample: A trader notices that Apple (AAPL) has consistently closed above its 50-day moving average for several weeks. They enter a long position, planning to exit if the price closes below that average, capturing gains as long as the trend persists.
2) Support and Resistance Trading
This strategy identifies key support and resistance levels where the price historically reverses. Traders look for buying opportunities near support levels and selling opportunities near resistance levels.
By analysing past price action, traders can anticipate potential reversals or breakouts, allowing for strategic entry and exit points.
Sample: Amazon (AMZN) bounces off $120 three times in one month. A trader buys near this support level, expecting another bounce, and plans to sell near the $135 resistance level.
3) momentum trading
Momentum trading involves entering trades based on the strength of recent price movements. Traders use indicators like the Relative Strength Index (RSI) to identify overbought or oversold conditions.
For example, an RSI value above 70 may indicate an overbought market, suggesting a potential sell opportunity, while a value below 30 may indicate an oversold market, suggesting a potential buy opportunity.
Sample: NVIDIA (NVDA) breaks out on strong earnings, and its RSI rises to 75. A trader enters a position, riding the momentum for a few days before locking in profits once signs of slowing appear.
4) Breakout trading
Breakout trading focuses on entering positions when the price breaks through established support or resistance levels. This strategy aims to capitalise on increased volatility and momentum following a breakout.
Traders often use volume indicators to confirm the strength of a breakout, ensuring that the price movement is supported by significant trading activity.
Sample: Tesla (TSLA) breaks above a consolidation range of $850 with increased volume. A trader enters a long position, expecting a sharp move upward due to the breakout.
5) Reversal Trading
Reversal trading seeks to identify points where the market will change direction. Traders look for patterns such as double tops or bottoms, head and shoulders, or candlestick formations like doji or hammer.
These patterns, combined with indicators like RSI or MACD, can signal potential trend reversals, allowing traders to enter positions early in a new trend.
Sample: After a long downtrend, Microsoft (MSFT) forms a double bottom pattern near $280. A trader goes long as the price starts climbing, betting on a trend reversal back to $310.
6) moving average crossover
This strategy uses the crossover of short-term and long-term moving averages to generate buy or sell signals. For example, when a 50-day moving average crosses above a 200-day moving average, it may signal a bullish trend, prompting a buy.
Conversely, when the 50-day moving average crosses below the 200-day moving average, it may signal a bearish trend, prompting a sell.
Sample: Netflix (NFLX) sees its 20-day moving average cross above its 50-day average. This bullish crossover prompts a trader to buy, with a plan to hold until a bearish crossover occurs.
7) Fibonacci Retracement
Fibonacci retracement levels help identify potential reversal levels by measuring the distance between significant price points. Traders use these levels to anticipate areas where the price may retrace before continuing in the original direction.
Regular retracement levels include 38.2%, 50%, and 61.8%, which often act as support or resistance levels.
Sample: Google (GOOGL) rallies from $100 to $120 and then pulls back. A trader places a buy order at the 61.8% Fibonacci level (~$108), expecting the uptrend to resume.
8) Candlestick Pattern Analysis
Analysing candlestick patterns allows traders to interpret market sentiment and predict potential price movements. Patterns like engulfing candles, doji, or hammer formations can indicate reversals or continuations in trends.
By combining candlestick analysis with other indicators, traders can enhance the accuracy of their predictions.
Sample: Meta Platforms (META) form a bullish engulfing candle pattern after a downtrend. A trader interprets this as a sign of buyer strength and enters a swing trade aiming for a 5–10% move.
9) Relative Strength Index (RSI) Strategy
The RSI measures the speed and change of price movements, helping identify overbought or oversold conditions. Traders use RSI to spot potential reversal points; for instance, an RSI above 70 may suggest the asset is overbought and due for a correction, while an RSI below 30 may indicate it is oversold and poised for a rebound.
Sample: When AMD's RSI dips below 30 during a market pullback, a trader buys the stock, anticipating a short-term bounce as the asset is considered oversold.
10) Volume Analysis
Volume analysis involves examining trading volumes to confirm trends and predict potential reversals. An increase in volume can validate a price movement, indicating strong investor interest.
Conversely, declining volume may signal a weakening trend. By analysing volume patterns, traders can make more informed decisions about entry and exit points.
Sample: A trader sees increased volume accompanying a breakout in Shopify (SHOP) above $60. The spike in volume confirms the breakout's strength, prompting a swing trade entry.
Conclusion
In conclusion, Implementing these swing trading strategies requires discipline, proper risk management, and continuous learning.
To achieve consistent success in swing trading, traders should backtest strategies, stay informed about market conditions, and continuously refine their approach.
Disclaimer: This material is for general information purposes only and is not intended as (and should not be considered to be) financial, investment or other advice on which reliance should be placed. No opinion given in the material constitutes a recommendation by EBC or the author that any particular investment, security, transaction or investment strategy is suitable for any specific person.


