In today's fast-moving financial world, learning how to read stocks is more than just a useful skill—it's essential for anyone looking to make informed investment decisions. Whether you're planning to manage your own portfolio or simply want to understand the charts and tickers you see on the news, developing this ability can open the door to greater confidence and control in your financial life.
This article will walk you through the key components of reading stocks, from understanding ticker symbols to analysing price charts and trading volume. By the end, you'll be equipped with the core tools to interpret stock market data effectively.
Why Learning How to Read Stocks Matters

Before diving into the technicals, let's take a step back and understand the importance of learning how to read stocks. At its core, stock reading is about interpreting the data that reflects a company's performance and market perception. This skill allows you to identify trends, time entries and exits, and assess the potential risk and return of your investments.
Whether you're a beginner or already familiar with financial markets, knowing how to read stocks helps you cut through the noise and make decisions based on actual market signals rather than speculation or emotion.
Understand Ticker Symbols and Stock Quotes

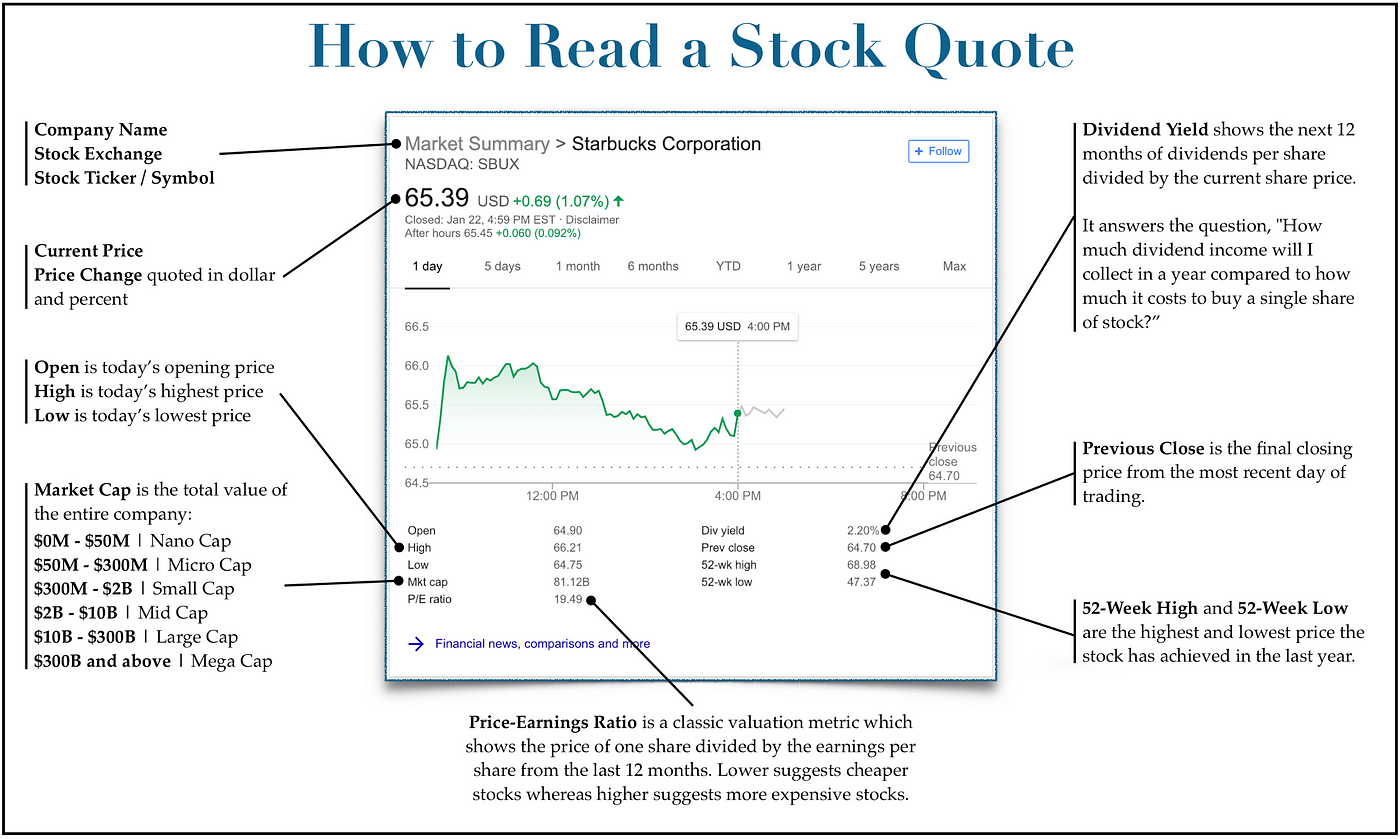
Every stock is identified by a ticker symbol, which is a unique abbreviation of the company name listed on an exchange. For instance, Apple trades under AAPL, while Tesco is listed as TSCO. The stock quote, on the other hand, gives you vital information including the current price, day's range, volume, and price changes.
Learning how to read stocks begins with recognising these symbols and understanding the elements of a quote. For example, a quote might display the last traded price, the price change since the previous close, and the percentage change. This gives you a snapshot of the stock's current standing in the market.
How to Read Stocks Through Price Charts

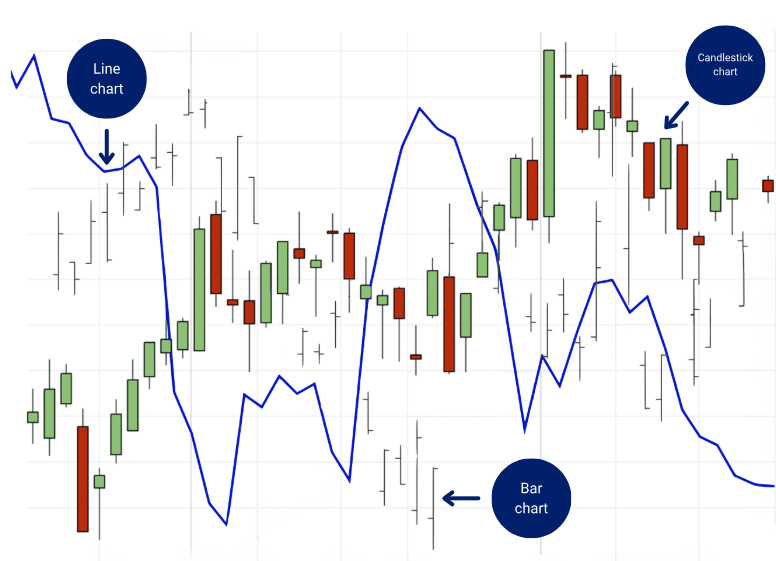
One of the most crucial aspects of learning how to read stocks is interpreting price charts. These visual tools show how a stock's price has changed over time and are available in different formats, such as line charts, bar charts, and candlestick charts.
Candlestick charts are particularly popular among traders. Each candle shows four key prices: the opening, closing, high, and low during a specific period. The colour of the candle typically indicates whether the price closed higher or lower than it opened. Learning to recognise patterns such as bullish engulfing or hammer candles can help you anticipate market moves.
Volume and Market Sentiment
Volume refers to the number of shares traded during a specific time period. High volume usually indicates strong interest in a stock, which could mean a potential breakout or reversal is underway. When learning how to read stocks, paying attention to volume can give you insight into the strength of a price movement.
For example, a price increase accompanied by high volume is generally seen as more trustworthy than one with low volume. Similarly, declining prices with increasing volume might signal strong bearish sentiment.
The Role of Moving Averages
Moving averages smooth out price data to help traders identify trends. The most commonly used are the 50-day and 200-day moving averages. These lines are plotted on a stock chart and provide context on where the stock price is in relation to its historical average.
A price crossing above a moving average might indicate a bullish trend, while crossing below could signal a bearish turn. These indicators are vital when learning how to read stocks, as they offer a clearer view of the overall direction.
Support and Resistance Levels
Support and resistance levels represent psychological barriers in Stock Prices. A support level is where the price tends to find a floor, while resistance is where it typically hits a ceiling. Recognising these levels can help you decide when to enter or exit a trade.
For example, if a stock consistently bounces off a certain price point, that level could be considered support. Conversely, repeated failure to rise above a certain level could mark resistance. These zones are vital reference points when learning how to read stocks with precision.
Technical Indicators and Signals
As you grow more comfortable with charts and price action, you may begin exploring technical indicators such as the Relative Strength Index (RSI), MACD, or Bollinger Bands. These tools help you gauge momentum, volatility, and potential reversals.
While you don't need to master all of them at once, choosing one or two indicators to start with can significantly enhance your understanding of how to read stocks effectively.
Avoid Common Mistakes
Many beginners make the mistake of relying too heavily on one aspect of stock analysis. Learning how to read stocks requires a balanced view, combining chart analysis, volume, and market context. Be wary of overtrading, ignoring fundamental data, or reacting emotionally to market swings.
It's also worth practising your stock reading skills using demo accounts or paper trading tools before risking real capital. This helps reinforce learning without the pressure of financial loss.
Final Thoughts
Reading stocks is not something you master overnight. Like any skill, it improves with practice and continuous learning. Follow the markets, keep a journal of your observations, and don't be afraid to test out new strategies in a low-risk environment.
There are countless online resources, courses, and community forums where you can exchange ideas and learn from others. The more time you invest in developing your understanding, the more confident you'll feel when making real trades.
Disclaimer: This material is for general information purposes only and is not intended as (and should not be considered to be) financial, investment or other advice on which reliance should be placed. No opinion given in the material constitutes a recommendation by EBC or the author that any particular investment, security, transaction or investment strategy is suitable for any specific person.


