The crude oil Put-Call Ratio (PCR) is a widely used indicator that reflects market sentiment by comparing the balance of bearish and bullish options activity.
Serving as a barometer of investor psychology, it provides traders and analysts with valuable context for anticipating price movements.
This article explores how the Crude Oil PCR is calculated, its historical trends, methods of interpretation, practical trading applications, limitations, and its role within broader risk management strategies.
What Do PCR Values Indicate About Market Sentiment?
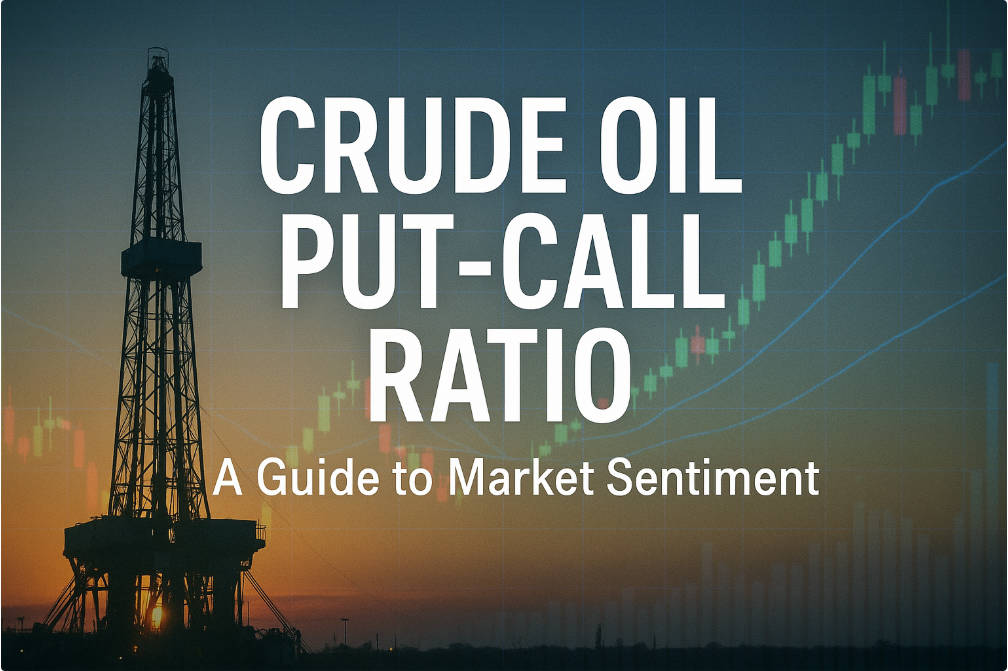
The crude oil PCR reflects market sentiment by comparing the volume of put options (bearish positions) with call options (bullish positions) in crude oil contracts.
As a sentiment barometer, the PCR aids traders and analysts in forecasting potential market moves and managing risk.
Definition and Calculation
The PCR is derived by dividing traded put options by traded call options within a set period.
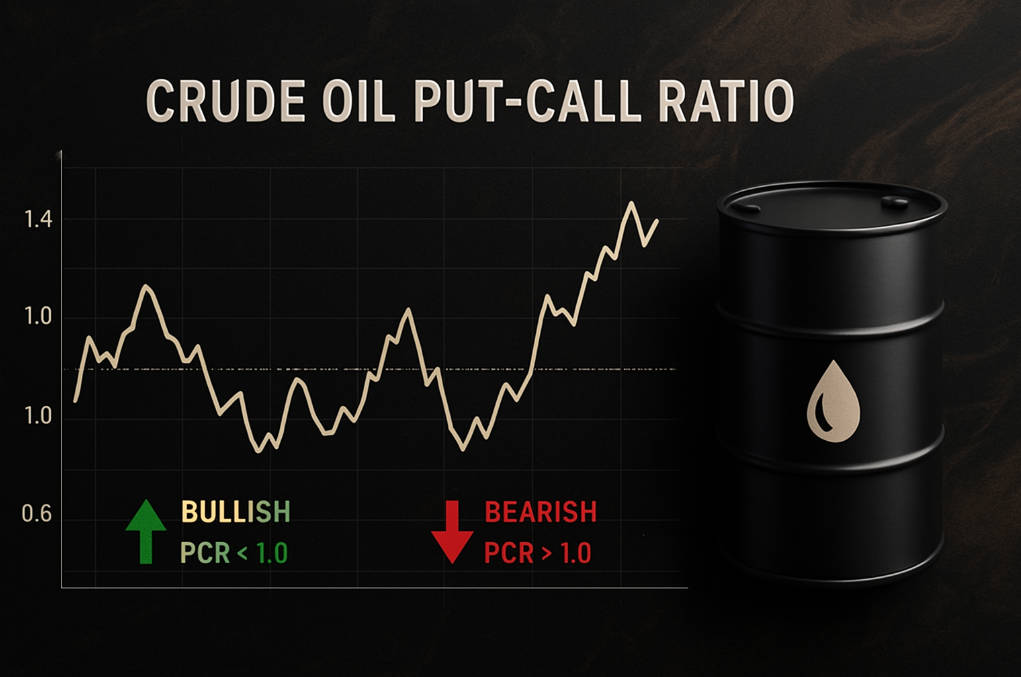
PCR > 1.0: Indicates more puts traded, signalling bearish sentiment.
PCR < 1.0: Indicates more calls traded, reflecting bullish sentiment.
Significance in Crude Oil Markets
In crude oil trading, the PCR highlights investor expectations. Elevated PCR values suggest hedging against price declines, while lower values often point to optimism for price gains.
Scope of Analysis
This report explores PCR calculation methods, historical patterns, interpretation strategies, practical uses in trading and hedging, as well as limitations when applied in isolation.
Methodology for Calculating and Analysing PCR
Data Sources and Reliability
Accurate PCR analysis depends on reliable exchanges and platforms:
Calculation Techniques
Volume-Based PCR: Ratio of total puts traded to total calls traded.
Open Interest-Based PCR: Ratio of open interest in puts versus calls, offering insight into sustained market positioning.
Analytical Tools and Techniques
Traders interpret PCR trends with the aid of statistical tools such as moving averages, Bollinger Bands, and RSI, which help identify sentiment shifts and potential reversals.
How Crude Oil PCR Reflects Historical Trends and Market Behaviour
Long-Term Trends
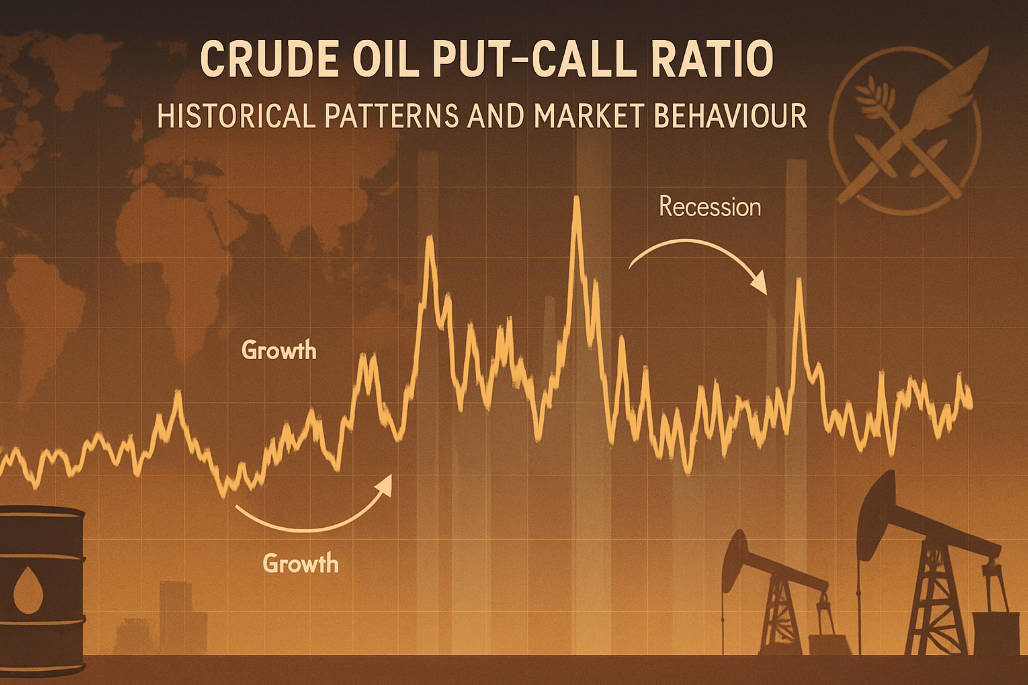
Historical PCR data in crude oil markets shows cyclical behaviour, shaped by economic cycles, geopolitical tensions, and seasonal demand.
PCR and Volatility
Rising PCR often precedes periods of heightened volatility, as hedging intensifies.
Falling PCR can reflect confidence and stabilising price conditions.
Impact of Events
Geopolitical shocks, OPEC production shifts, sanctions, and regional conflicts frequently trigger PCR surges. For example, heightened tensions in the Middle East have historically driven PCR higher, signalling increased downside hedging.
Interpreting PCR Values
Bearish (>1.0): Reflects heavier demand for puts, suggesting downside protection or pessimism.
Bullish (<1.0): Indicates more calls traded, pointing to optimism and potential price increases.
Contrarian Indicator: Extreme levels (>1.5 or <0.5) may imply excessive pessimism or optimism, foreshadowing a reversal.
Practical Applications of Crude Oil PCR in Trading and Risk Management
Hedging Strategies
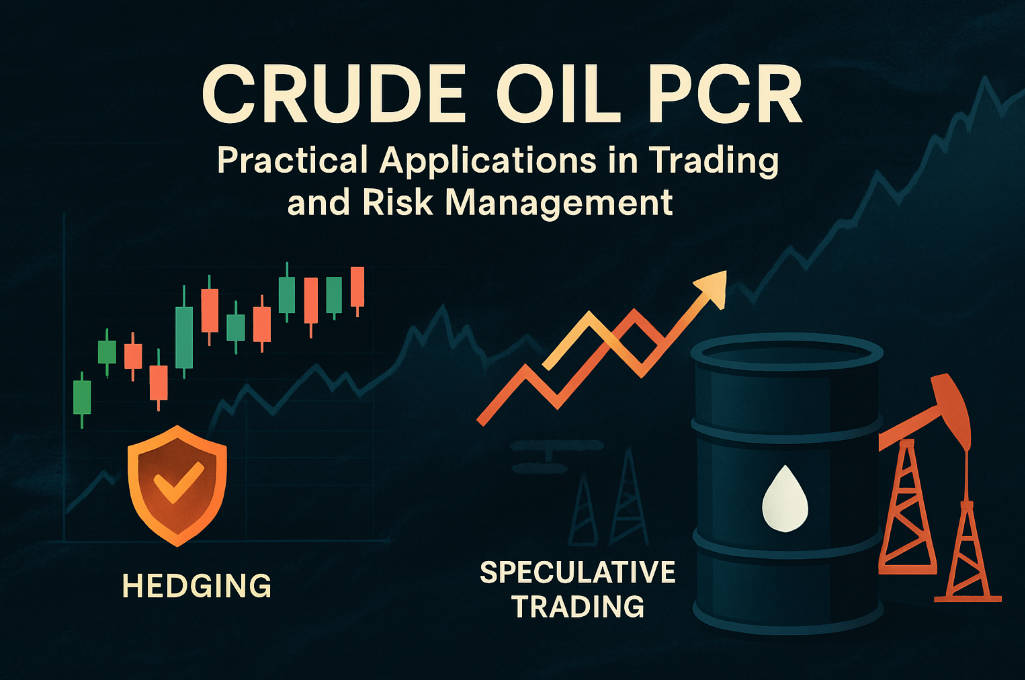
Producers, refiners, and traders can use PCR insights to manage price risk. A high PCR may justify protective hedges, while a low PCR could be used to lock in profits.
Speculative Trading
Speculative traders track PCR shifts for entry and exit timing:
Risk Management Frameworks
Integrating PCR with broader risk management improves resilience. Used alongside volatility measures and fundamentals, PCR enhances decision-making and portfolio protection.
Limitations, Challenges, and Complementary Indicators for PCR
Potential Distortions
Market anomalies—such as low liquidity or unusual trading spikes—can distort PCR readings and provide misleading signals.
Complementary Indicators
To improve reliability, PCR should be combined with:
Data Accuracy
Consistent and high-quality data is essential. Misreporting or calculation errors may lead to flawed sentiment assessments.
Conclusion and Strategic Implications
The crude oil PCR is an essential sentiment indicator, offering traders valuable signals on market psychology. While it provides meaningful insights, its effectiveness increases when complemented with other analytical tools and robust risk frameworks.
Key Insights:
PCR > 1.0 signals bearish sentiment; PCR < 1.0 signals bullish sentiment.
Extreme PCR values may act as contrarian indicators, warning of reversals.
PCR is best used in combination with other technical and fundamental measures.
Future Outlook
As crude oil markets remain sensitive to global economics and geopolitics, the PCR will continue to play a central role in sentiment analysis. Advances in trading technology and data analytics are expected to refine its use, improving accuracy and decision-making for market participants.
Frequently Asked Questions (FAQ)
Q1: What does a PCR value above 1.0 indicate in the crude oil market?
A PCR above 1.0 suggests that more put options are being traded, indicating a bearish market sentiment. Traders may interpret this as a signal to consider protective strategies or to anticipate potential price declines.
Q2: How can traders apply PCR insights to their trading strategies?
Traders can use PCR to gauge market sentiment and adjust their positions accordingly. A high PCR may prompt traders to consider protective strategies, while a low PCR may indicate potential buying opportunities.
Q3: What are the limitations of relying solely on PCR for market decisions?
While PCR is a valuable tool, it should not be used in isolation. Market anomalies, such as low liquidity or unusual trading volumes, can distort PCR readings. It is essential to consider other indicators and market factors to make informed decisions.
Q4: How often should PCR be monitored for effective trading?
The frequency of monitoring PCR depends on the trader's strategy. Short-term traders may monitor PCR daily, while long-term investors might review it weekly or monthly. Regular monitoring allows traders to stay informed about changing market sentiments.
Disclaimer: This material is for general information purposes only and is not intended as (and should not be considered to be) financial, investment or other advice on which reliance should be placed. No opinion given in the material constitutes a recommendation by EBC or the author that any particular investment, security, transaction or investment strategy is suitable for any specific person.
