Published on: 2025-06-11
Updated on: 2025-06-11
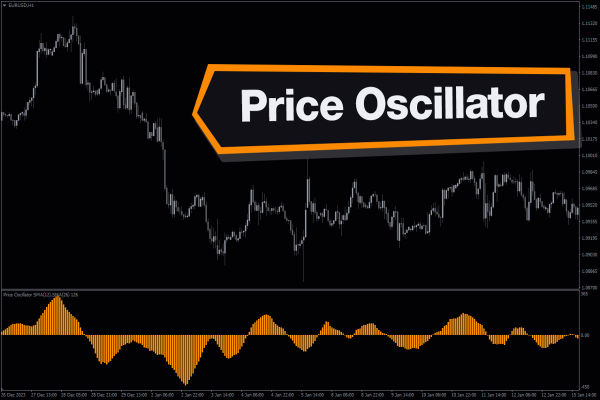
The Price Oscillator is a popular technical analysis tool used by traders to assess price momentum. It helps to identify trends, potential reversals and the strength of price movements.
By comparing two moving averages, the Price Oscillator gives traders a clear picture of market direction. Whether you are trading forex, stocks or commodities, understanding how the Price Oscillator works can improve your decision-making process and timing.
This article breaks down the Price Oscillator in simple terms, showing how it is calculated, interpreted and used effectively in a trading strategy.

At its core, the Price Oscillator measures the difference between two exponential moving averages (EMAs) of a security's price. One is a shorter-term EMA and the other is a longer-term EMA. The result is plotted as a single line that moves above and below a zero line.
The formula is straightforward:
Price Oscillator = Short-term EMA − Long-term EMA
When the Price Oscillator is above zero, it means the short-term EMA is higher than the long-term EMA, suggesting upward momentum. When it is below zero, the opposite is true, indicating downward momentum.
This setup allows traders to view shifts in momentum at a glance, making it easier to spot trends or potential turning points.
Many traders rely on the Price Oscillator to confirm trends, generate signals or support other technical indicators. Because it reacts to price changes, the Price Oscillator is especially useful in identifying periods when momentum is building or fading.
For example, if the Price Oscillator crosses from below to above the zero line, it may suggest the start of a bullish move. Conversely, a cross from above to below zero could signal a bearish turn. However, most traders avoid using it in isolation and instead combine it with other tools such as moving average convergence divergence (MACD), relative strength index (RSI) or support and resistance levels.
The Price Oscillator is also valued for its simplicity. It strips out noise from raw price data and offers a smoothed, more readable trend signal. This helps traders stay objective, especially in fast-moving markets.
When interpreting the Price Oscillator, traders look for several key signals. The most common is the zero-line crossover. A rise above the zero level suggests increasing buying pressure, while a drop below zero implies growing selling pressure.
Another method is to look at the shape and slope of the Price Oscillator line. A rising oscillator that continues to increase indicates growing bullish momentum, while a falling line suggests accelerating bearish sentiment.
Some traders also look for divergence. This occurs when the price of the asset moves in the opposite direction to the Price Oscillator. For example, if prices are making new highs but the oscillator is not, it could signal weakening momentum and a potential reversal.
Despite its usefulness, the Price Oscillator is not foolproof. False signals can occur, particularly in choppy or range-bound markets. This is why it is best used as part of a broader Trading plan rather than as a standalone signal.

Most trading platforms allow users to customise the short-term and long-term moving averages used in the Price Oscillator. Common settings include 12-day and 26-day EMAs, which are the same used in the macd indicator. However, traders can adjust these to suit their strategy or timeframe.
Shorter timeframes may produce more signals but can also result in more noise. Longer timeframes tend to give more reliable signals but may lag behind actual price action. It is important to test different settings in a demo environment to find what works best for your trading style.
By tailoring the Price Oscillator to your asset and timeframe, you can improve its accuracy and reduce the likelihood of false signals.
One of the main advantages of the Price Oscillator is its clarity. It provides a straightforward signal that is easy to interpret. Traders can quickly see whether momentum is bullish or bearish, helping to make faster, more confident decisions.
It also works well in trending markets, where it can help confirm direction and improve entry and exit timing. Because it is based on EMAs, it responds relatively quickly to price changes while still offering some smoothing.
However, the Price Oscillator also has its limitations. In sideways or volatile markets, it can produce false signals. Relying on it alone may lead to mistimed trades. For this reason, many traders pair it with other indicators or use it in conjunction with support and resistance analysis.
Another consideration is that the Price Oscillator is a lagging indicator. It is based on historical price data and may not reflect sudden changes or news-driven events. As such, it is most effective when used with a well-rounded strategy that includes risk management and market awareness.
For traders looking to add structure to their analysis, the Price Oscillator offers a simple yet powerful tool. By comparing short-term and long-term moving averages, it provides insight into price momentum and helps to identify trends or reversals.
If you are considering using the Price Oscillator in your trading, take the time to test different settings and see how it performs across different market conditions. The key to success lies not just in the tool itself but in how you apply it with discipline and consistency.
Disclaimer: This material is for general information purposes only and is not intended as (and should not be considered to be) financial, investment or other advice on which reliance should be placed. No opinion given in the material constitutes a recommendation by EBC or the author that any particular investment, security, transaction or investment strategy is suitable for any specific person.