In the Forex market, price is king. Every movement on the chart—every swing high, every sharp drop—tells a story about supply, demand, and trader sentiment. To navigate the market effectively, traders must develop a solid understanding of market structure, a framework used to read price action and anticipate future moves.
Unlike indicators that lag behind price, market structure focuses on real-time price behaviour—identifying patterns that reflect the balance of power between buyers and sellers. This article breaks down the key elements of Forex market structure, from trends and breakouts to support and resistance levels, and shows how traders can apply these concepts across multiple timeframes.
Market Structure Basics: HH/HL & LH/LL
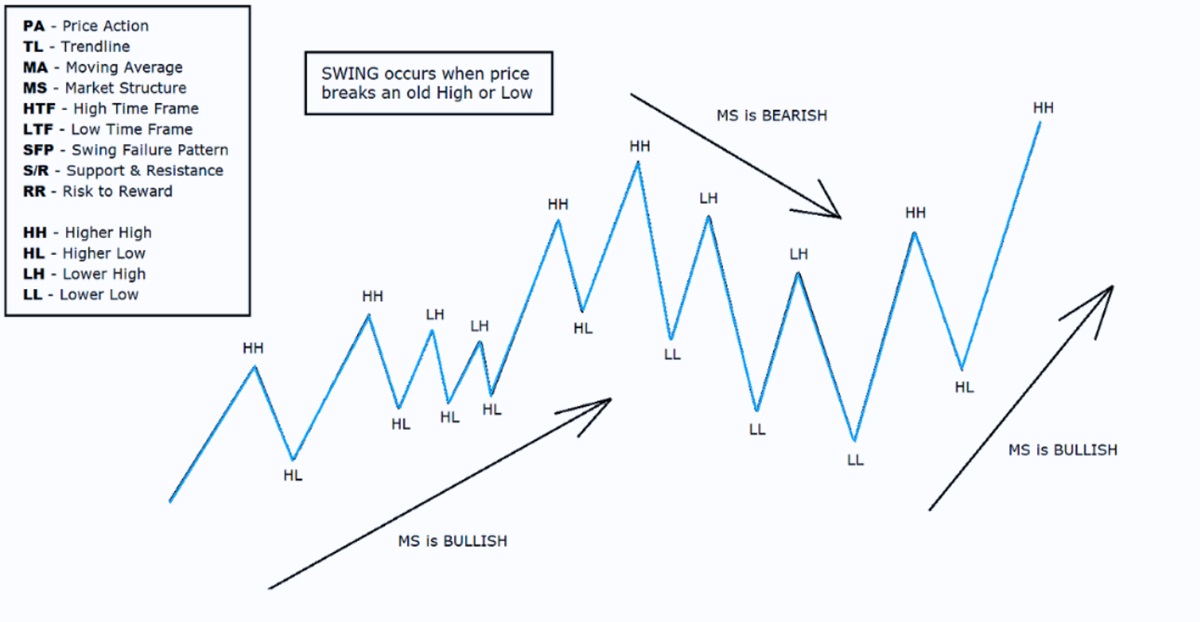 At the core of market structure analysis is the identification of swing highs and swing lows. These turning points help traders determine the direction of the trend:
In a bullish structure, price forms higher highs (HH) and higher lows (HL).
In a bearish structure, price creates lower highs (LH) and lower lows (LL).
A bullish sequence signals growing buyer strength, while a bearish sequence reflects sustained selling pressure. Recognising these patterns early allows traders to align their positions with the prevailing trend.
For example, if EUR/USD has just formed a higher low above a previous resistance level, this could indicate that buyers are stepping in more aggressively—an opportunity to consider long positions. Conversely, lower highs and lower lows may suggest continued weakness and potential short setups.
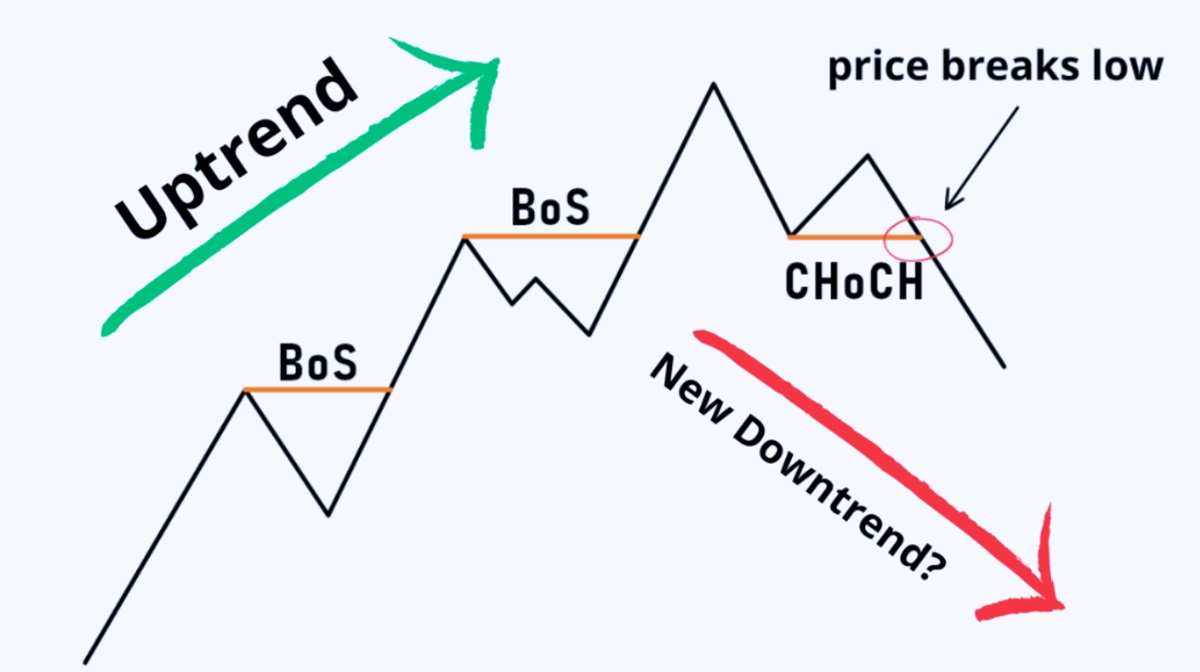 While trends offer a directional bias, it's the break of structure (BoS) and change of character (ChoCH) that alert traders to potential shifts in momentum.
A Break of Structure occurs when price violates a previous swing high or low, confirming the continuation of a trend.
A Change of Character signals the early stages of reversal—for example, when a bearish market forms its first higher high or a bullish market creates a lower low.
These two concepts are especially important for swing traders and scalpers, who rely on structure shifts to time entries and exits. By identifying a BoS or ChoCH, traders can anticipate whether the current trend is likely to continue or whether a new one is emerging.
As an example, if GBP/USD has been printing lower highs and suddenly breaks above a recent swing high (BoS), it could indicate that bearish momentum is weakening. If this is followed by a higher low (ChoCH), a new uptrend may be forming.
Trend, Range, and Sideways Phases
Not all markets trend—and recognising consolidation is just as important as spotting a trend. Generally, Forex price action cycles through three phases:
1.Trending – Clear direction with HH/HL or LH/LL patterns.
2.Ranging – Price oscillates between horizontal support and resistance.
3.Transitional (sideways) – Often a precursor to breakouts or reversals.
Understanding the current phase is critical to selecting the right strategy. Trend-following approaches work well during directional moves, while range-trading strategies are more effective during consolidation.
AUD/USD, for instance, may range between 0.6600 and 0.6700 for weeks. A breakout with strong momentum and a confirmed BoS would signal a return to trending conditions. Staying out during choppy, indecisive periods helps reduce noise and false signals.
Support & Resistance Dynamics
Support and resistance are the building blocks of structure. They're not just psychological zones—they're where order flow accumulates, liquidity pools form, and price tends to react.
Support is a price level where demand outweighs supply, preventing price from falling further.
Resistance is where supply overtakes demand, halting upward momentum.
In market structure terms, previous swing highs and lows often become future support or resistance levels. These zones gain even more significance when aligned with round numbers, Fibonacci levels, or moving averages.
For example, if USD/JPY breaks above 155.00—a former resistance—and then retests this level as support, it signals a strong bullish structure. Traders might use these areas to plan pullback entries or define stop-loss levels.
Multi-Timeframe Analysis & Fractals
One of the most powerful ways to enhance market structure analysis is through multi-timeframe analysis. Trends and structure are fractal in nature—meaning they repeat on different timeframes. A bearish structure on the 15-minute chart may be a pullback within a bullish trend on the 4-hour chart.
By assessing structure across multiple timeframes, traders can:
Spot higher timeframe trends to trade in alignment with the macro direction.
Use lower timeframes to refine entries and exits.
Identify conflicting signals that may suggest range-bound conditions.
For instance, a trader analysing GBP/USD might observe:
A higher-timeframe uptrend on the daily chart (HHs and HLs),
A temporary bearish structure on the 1-hour chart (LHs and LLs),
A potential BoS on the 15-minute chart indicating a return to the overall uptrend.
Understanding this multi-layered view can help traders avoid trading against momentum and find high-probability trade setups.
Final Thoughts
Reading market structure is one of the most reliable methods for interpreting Forex price action. By understanding how highs and lows form, recognising structure breaks and trend transitions, and incorporating support/resistance zones and multi-timeframe context, traders can better anticipate market moves—without relying heavily on lagging indicators.
Market structure isn't about predicting the future; it's about reading the present. When used with discipline and clear risk management, it provides a framework to trade with clarity in an often chaotic market.
Disclaimer: This material is for general information purposes only and is not intended as (and should not be considered to be) financial, investment or other advice on which reliance should be placed. No opinion given in the material constitutes a recommendation by EBC or the author that any particular investment, security, transaction or investment strategy is suitable for any specific person.


