Published on: 2025-05-08
Updated on: 2026-04-22
Candlestick patterns are widely used in technical analysis to assess possible reversals and continuation moves. Among them, the hanging man candle is a potential bearish reversal pattern that forms after an uptrend.
It suggests that bullish momentum may be weakening and that sellers were able to push price sharply lower during the session, even if buyers recovered part of the move before the close.
In this article, we'll explain how the hanging man candle forms, how traders confirm it, where it tends to be more useful, and how to combine it with other technical tools before making a trading decision.

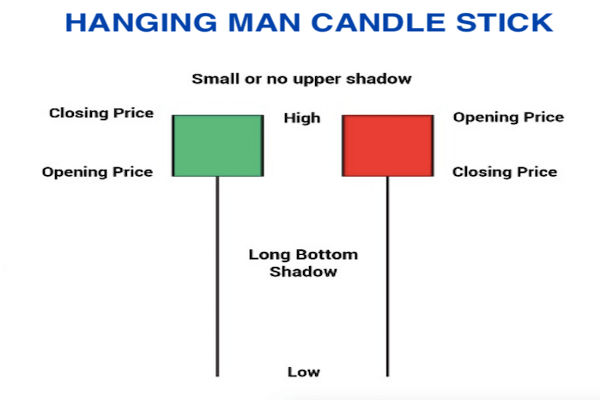
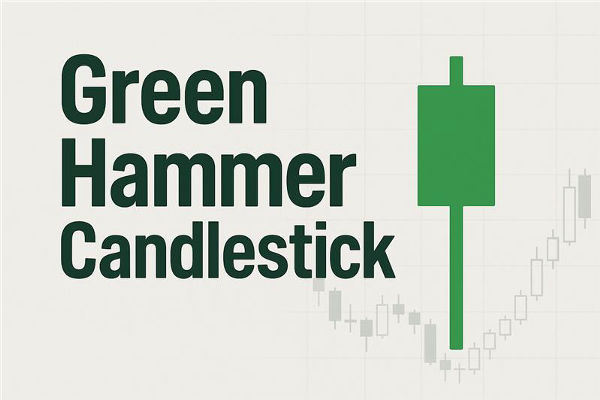
The Hanging Man is a single-candle bearish reversal pattern that appears after an uptrend. It resembles the Hammer pattern, but the context is different: the Hanging Man appears near the top of a move and warns that bullish momentum may be stalling.
The candle has a small real body near the top of the trading range and a long lower shadow, usually at least twice the length of the body. There is little to no upper shadow. This shape shows that sellers pushed price lower during the session before buyers recovered toward the close. Even so, the long lower wick suggests that selling pressure has started to appear beneath the surface.
It's called the "Hanging Man" because it resembles a figure hanging from a rope, with the body at the top and the lower shadow below. In practice, traders treat it as a warning sign, not a standalone sell signal, and usually wait for confirmation from the next candle, volume, or a break of support.
The Hanging Man and the Hammer can look almost identical, but the trend context changes the meaning. A Hammer appears after a decline and suggests a possible bullish reversal, while a Hanging Man appears after an advance and warns of a possible bearish reversal.
A Shooting Star is also bearish after an uptrend, but its long shadow is on the upper side rather than the lower side.
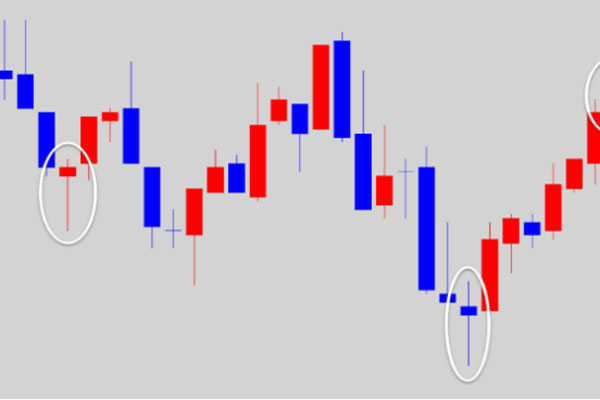
To accurately identify a Hanging Man candle, it must satisfy specific visual criteria:
It forms after a recognisable uptrend
The body is small and located near the top of the candle
The lower shadow is at least twice the length of the body
There is little to no upper shadow
It ideally appears with higher volume, which can make the rejection more meaningful
To strengthen its predictive value, traders should look for confirmation in the form of:
A bearish follow-through candle that closes below the Hanging Man low
Increased selling volume on the pattern candle or the confirmation candle
Break of a nearby support level
When a Hanging Man follows a strong bearish candle (such as a long red candlestick), it reinforces the bearish sentiment and increases the likelihood of a downward reversal. Volume is also critical; high trading volume on the day the Hanging Man forms, or on the confirmation day, lends credibility to the pattern.
Without confirmation, the Hanging Man might be a one-day anomaly in an otherwise strong uptrend. Consequently, disciplined traders wait for a clear bearish signal before taking action.
The Hanging Man candlestick pattern can appear on any timeframe, but it generally becomes more meaningful on higher timeframes because they filter out more noise.
Daily, weekly, and 4-hour charts usually provide cleaner context than very short intraday charts, where false signals are more common.
For swing and position traders, the daily chart is often the most practical timeframe for spotting Hanging Man setups. Day traders can still use the pattern on 15-minute to 1-hour charts, but confirmation matters more and risk controls need to be tighter.

Strategy 1: Exit Long Positions
One of the most straightforward applications of the Hanging Man candle is to signal an exit from existing long positions. If you are riding an uptrend and a Hanging Man forms, it could be an early warning that the trend is losing strength. You may tighten your stop-loss or exit partially or fully from the trade, especially if confirmation follows the next day.
This approach allows you to protect profits and avoid getting caught in a potential reversal.
Strategy 2: Enter Short Positions
More aggressive traders may use the Hanging Man as a signal to initiate a short position, but only after confirmation. Waiting for a bearish candlestick on the next trading day helps confirm that the sellers are taking control.
This short strategy often includes placing a stop-loss above the high of the Hanging Man and targeting nearby support zones for profit-taking. Risk-reward ratios should be carefully calculated to manage exposure.
Strategy 3: Combine with Indicators
The effectiveness of the Hanging Man pattern improves when it is combined with other technical tools rather than used on its own. Some of the most common confirmation tools include:
Relative Strength Index (RSI): An RSI reading above 70 can support the idea that the market is stretched, but it should not replace price confirmation.
Moving Averages: If the Hanging Man appears near a widely watched moving average and price fails to push higher, that area can reinforce the reversal signal.
Fibonacci Retracement: A Hanging Man near a key Fibonacci level can add weight to the idea that price is meeting resistance and may be ready for a pullback.
Using these tools together improves the reliability of your trading decisions and reduces false signals.
Suppose a stock rallies into a prior resistance area after several strong daily candles. A Hanging Man forms with a small body near the session high and a long lower shadow.
If the next candle closes below the Hanging Man low on increased volume, traders may treat that move as confirmation, reduce long exposure, or look for a short setup with a stop above the pattern high.
Suppose EUR/USD trends higher on a 4-hour chart and then prints a Hanging Man just below a clear resistance zone. If the next candle closes lower and price then breaks a nearby support level, the pattern becomes more meaningful.
A trader might place a stop above the Hanging Man high and use the next support area as an initial profit target, checking that the trade still offers an acceptable Risk-Reward Ratio.
Ignoring the trend context: The Hanging Man is only valid after an uptrend. Seeing a similar candle in a downtrend is likely a different pattern altogether.
Failing to wait for confirmation: Acting on the Hanging Man alone without waiting for bearish confirmation increases the risk of false signals.
Misidentifying similar patterns: The Hanging Man and the Hammer look alike, but their location in the trend makes all the difference. Always consider the surrounding price action.
Overemphasising the signal: Like all technical tools, the Hanging Man is not infallible. Use it as part of a broader analysis rather than as the sole basis for your trade.
Treating every long lower wick as a Hanging Man: The pattern only matters when it forms after a clear uptrend and near a meaningful area on the chart.
The Hanging Man is not reliable enough to use in isolation. In strong uptrends, price can keep rising even after the pattern appears, especially when there is no bearish follow-through, no increase in volume, or no break below support.
Traders should also remember that the same candle shape can mean different things depending on context, which is why trend direction, nearby levels, and confirmation matter more than the candle alone.
No. It is a warning sign of potential weakness after an uptrend, but it needs confirmation before traders treat it as a higher-conviction bearish signal.\n\n
Common forms of confirmation include a bearish follow-through candle, stronger selling volume, or a break below a nearby support level.
It can appear on any timeframe, but daily, weekly, and 4-hour charts usually give clearer context than very short intraday charts.
In conclusion, the Hanging Man candlestick pattern can help traders spot early signs of exhaustion after an uptrend, but it works best when combined with confirmation, volume, and nearby price levels.
Used carefully, it can support decisions on trade management, exits, and short-entry planning. Like any candlestick signal, it should be one part of a broader trading process that includes context, risk management, and patience.