Published on: 2024-05-17
Updated on: 2026-07-01
The Sharpe Ratio helps investors assess whether an investment's return is worth the risk. A portfolio that gains 14% is not automatically better than one that gains 9%. If the first portfolio swings sharply and the second delivers steadier returns, the lower-return portfolio may be the more efficient investment.
This matters more when cash and Treasury bill yields are no longer close to zero. When low-risk assets offer meaningful returns, investors need to know whether a fund, portfolio, or trading strategy is truly adding value above that baseline. The Sharpe Ratio answers that question by measuring excess return per unit of volatility.
The Sharpe Ratio measures how much excess return an investment generates relative to its risk.
The formula is portfolio return minus the risk-free rate, divided by standard deviation.
A higher Sharpe Ratio usually means better risk-adjusted performance, assuming the investments are measured over the same period and face similar market conditions.
A negative Sharpe Ratio can occur even when returns are positive if the investment underperforms the risk-free rate.
The Sharpe Ratio works best for maximum drawdown, Sortino Ratio, fees, liquidity, and downside risk analysis.
The Sharpe Ratio is a risk-adjusted performance measure. It compares an investment’s return with the return available from a low-risk asset, then adjusts that excess return for volatility. It shows how much reward an investor received for each unit of risk taken.
A high return with high volatility may not look impressive after adjustment. A moderate return with lower volatility may produce a stronger Sharpe Ratio.
Investors use the Sharpe Ratio across mutual funds, ETFs, hedge funds, portfolios, and trading systems. It is especially useful when two investments have similar objectives but different return patterns.
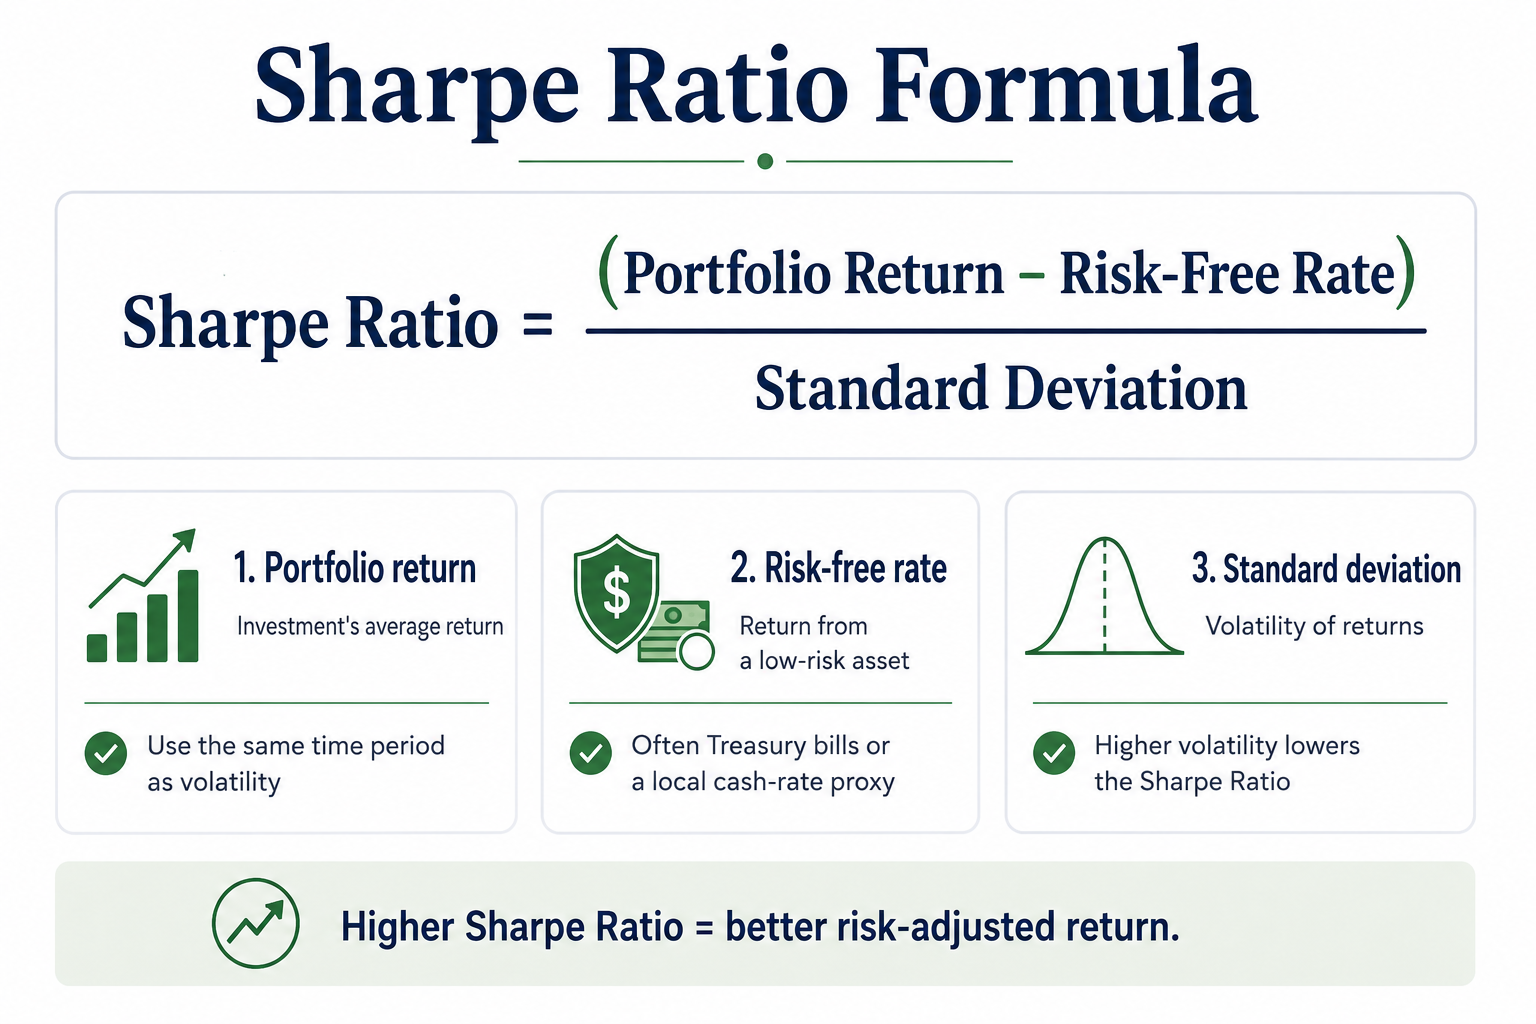 The formula is: Sharpe Ratio = (Portfolio Return − Risk-Free Rate) / Standard Deviation
For example, if a portfolio returns 12%, the risk-free rate is 3.6%, and volatility is 10%, the Sharpe Ratio is:
(12% − 3.6%) / 10% = 0.84
That means the portfolio generated 0.84 units of excess return for every unit of volatility.
The choice of risk-free rate matters. A 5% return looked attractive when interest rates were near zero. It looks much less impressive when Treasury bills offer similar returns with almost no volatility.
When interest rates rise, the hurdle rate for risky assets rises with them. A strategy must beat cash by a wider margin before its excess return looks attractive. This is why the same portfolio return can produce a lower Sharpe Ratio in a higher-rate environment.
Use the calculator below to estimate the risk-adjusted performance of a portfolio, fund, or trading strategy.
| Input | Value |
|---|---|
| Return | 12% |
| Risk-Free Rate | 3.6% |
| Volatility | 10% |
| Sharpe Ratio | 0.84 |
A Sharpe Ratio of 0.84 means the portfolio generated 0.84 units of excess return for every unit of volatility.
The calculator should use consistent time periods. The annual return should be compared with the annual risk-free rate and the annualised volatility. Daily or monthly figures should be converted before comparison.
This is the investment’s return over the selected period. It may be an annual return, monthly return, or the average return from a trading strategy.
The difference between the portfolio return and the risk-free rate is the excess return. It shows how much extra return the investor earned for taking risk.
Standard deviation measures volatility. Dividing excess return by standard deviation shows the reward earned per unit of risk.
A higher result usually indicates stronger risk-adjusted performance, but the comparison only holds when the assets, time period, and data frequency are consistent.
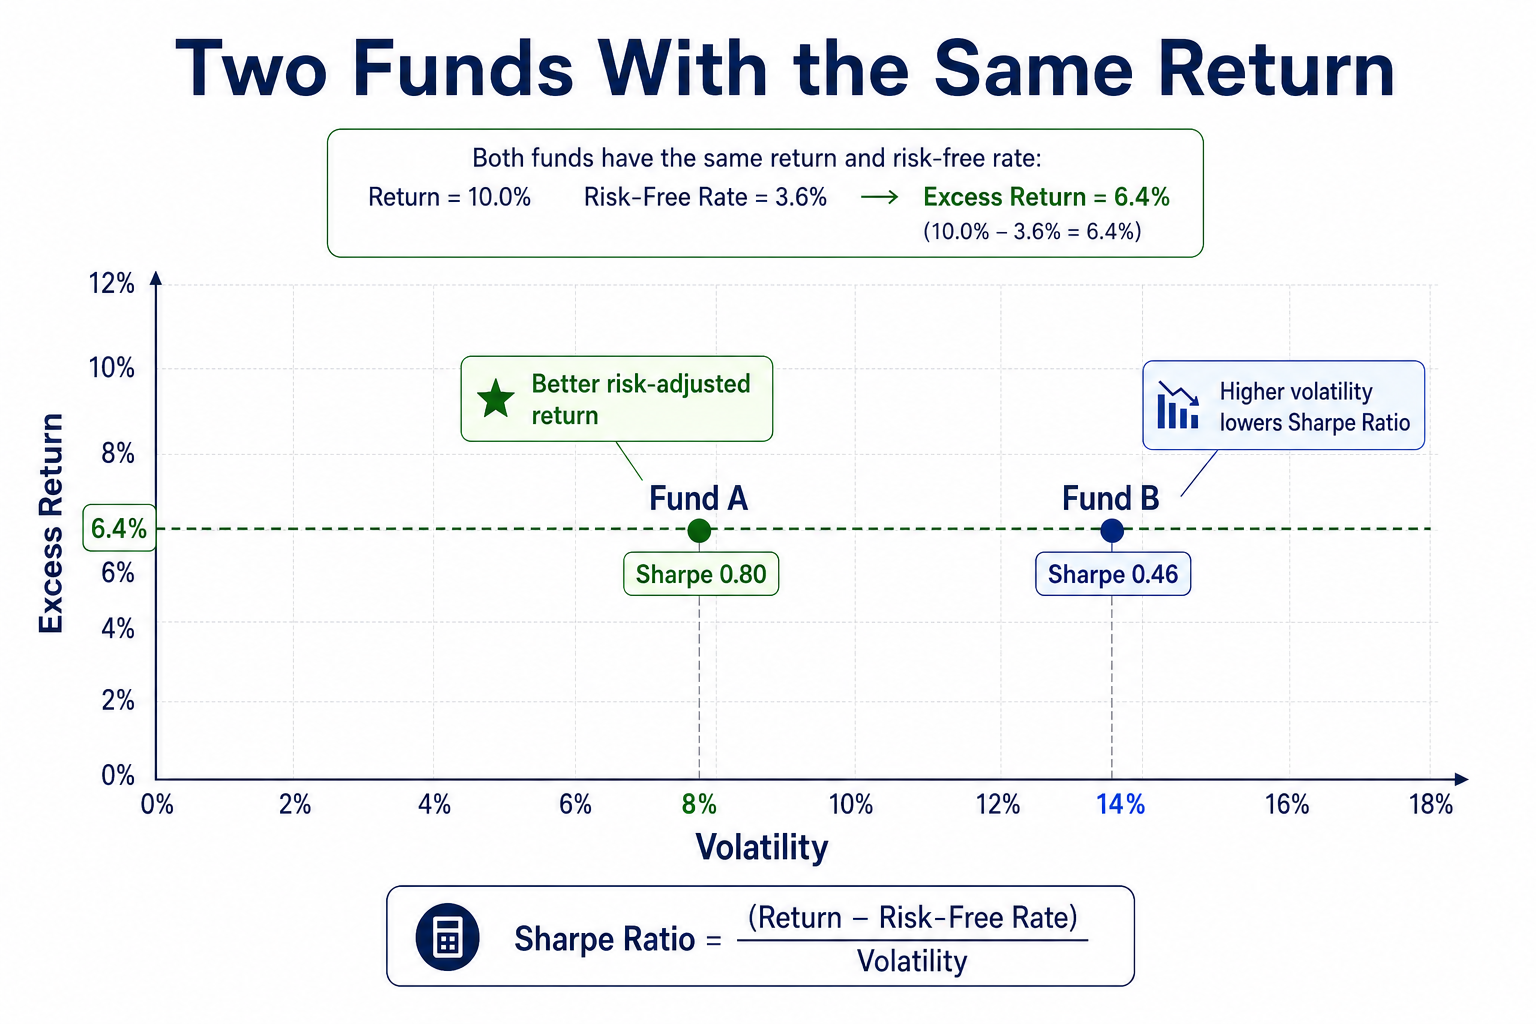
| Fund | Return | Risk-Free Rate | Volatility | Sharpe Ratio |
|---|---|---|---|---|
| Fund A | 10% | 3.6% | 8% | 0.80 |
| Fund B | 10% | 3.6% | 14% | 0.46 |
Both funds earned 10%, but Fund A used risk more efficiently. Its lower volatility produced a higher Sharpe Ratio. This is why return alone can mislead investors.
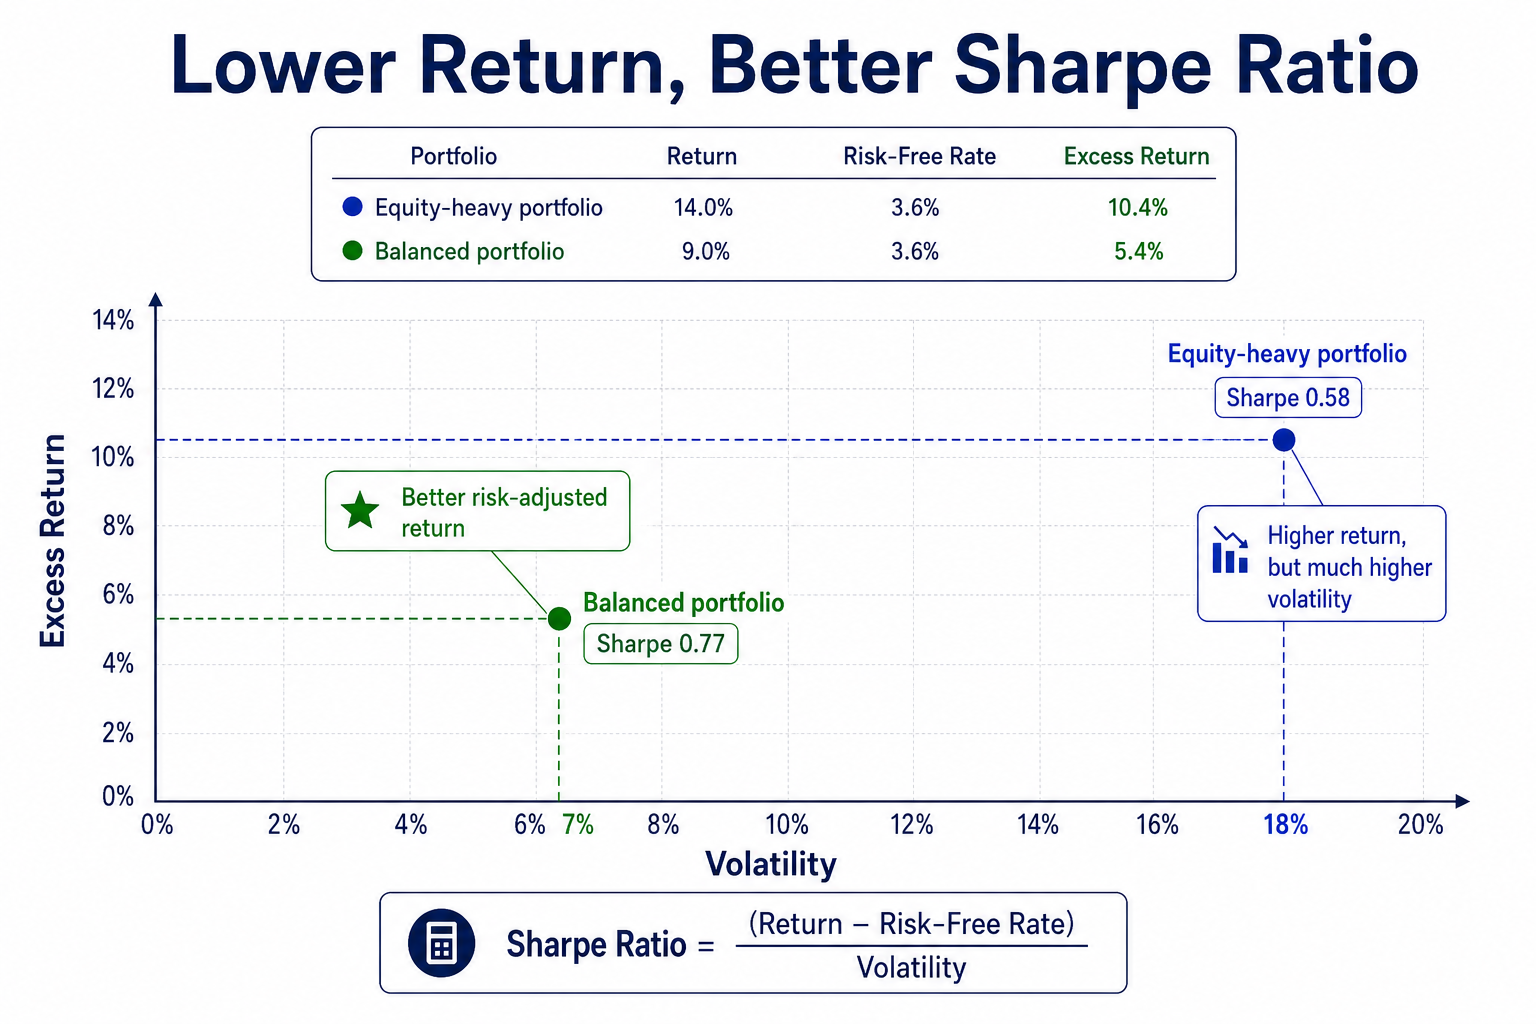
| Portfolio | Return | Risk-Free Rate | Volatility | Sharpe Ratio |
|---|---|---|---|---|
| Equity-Heavy Portfolio | 14% | 3.6% | 18% | 0.58 |
| Balanced Portfolio | 9% | 3.6% | 7% | 0.77 |
The equity-heavy portfolio generated the higher return, but the balanced portfolio produced the better Sharpe Ratio. Its lower volatility improved risk-adjusted performance.
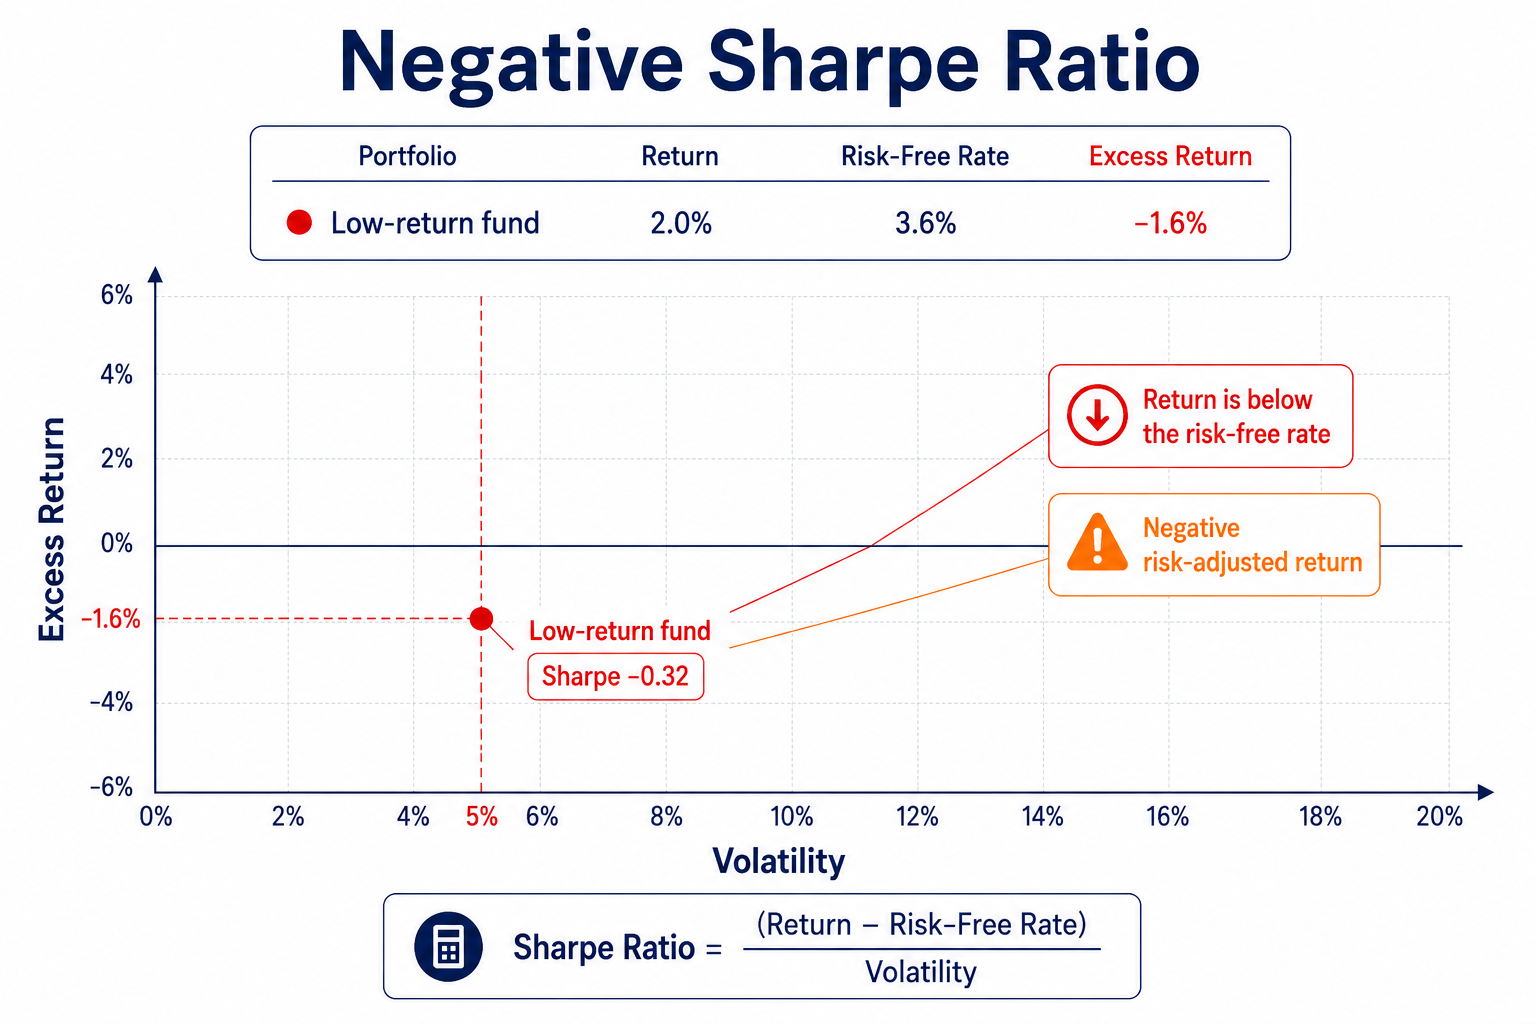
| Portfolio | Return | Risk-Free Rate | Volatility | Sharpe Ratio |
|---|---|---|---|---|
| Low-Return Fund | 2% | 3.6% | 5% | -0.32 |
A negative Sharpe Ratio does not always mean the investment lost money. It means the return failed to beat the risk-free rate after accounting for volatility. In this case, the investor accepted risk and still underperformed the low-risk alternative.
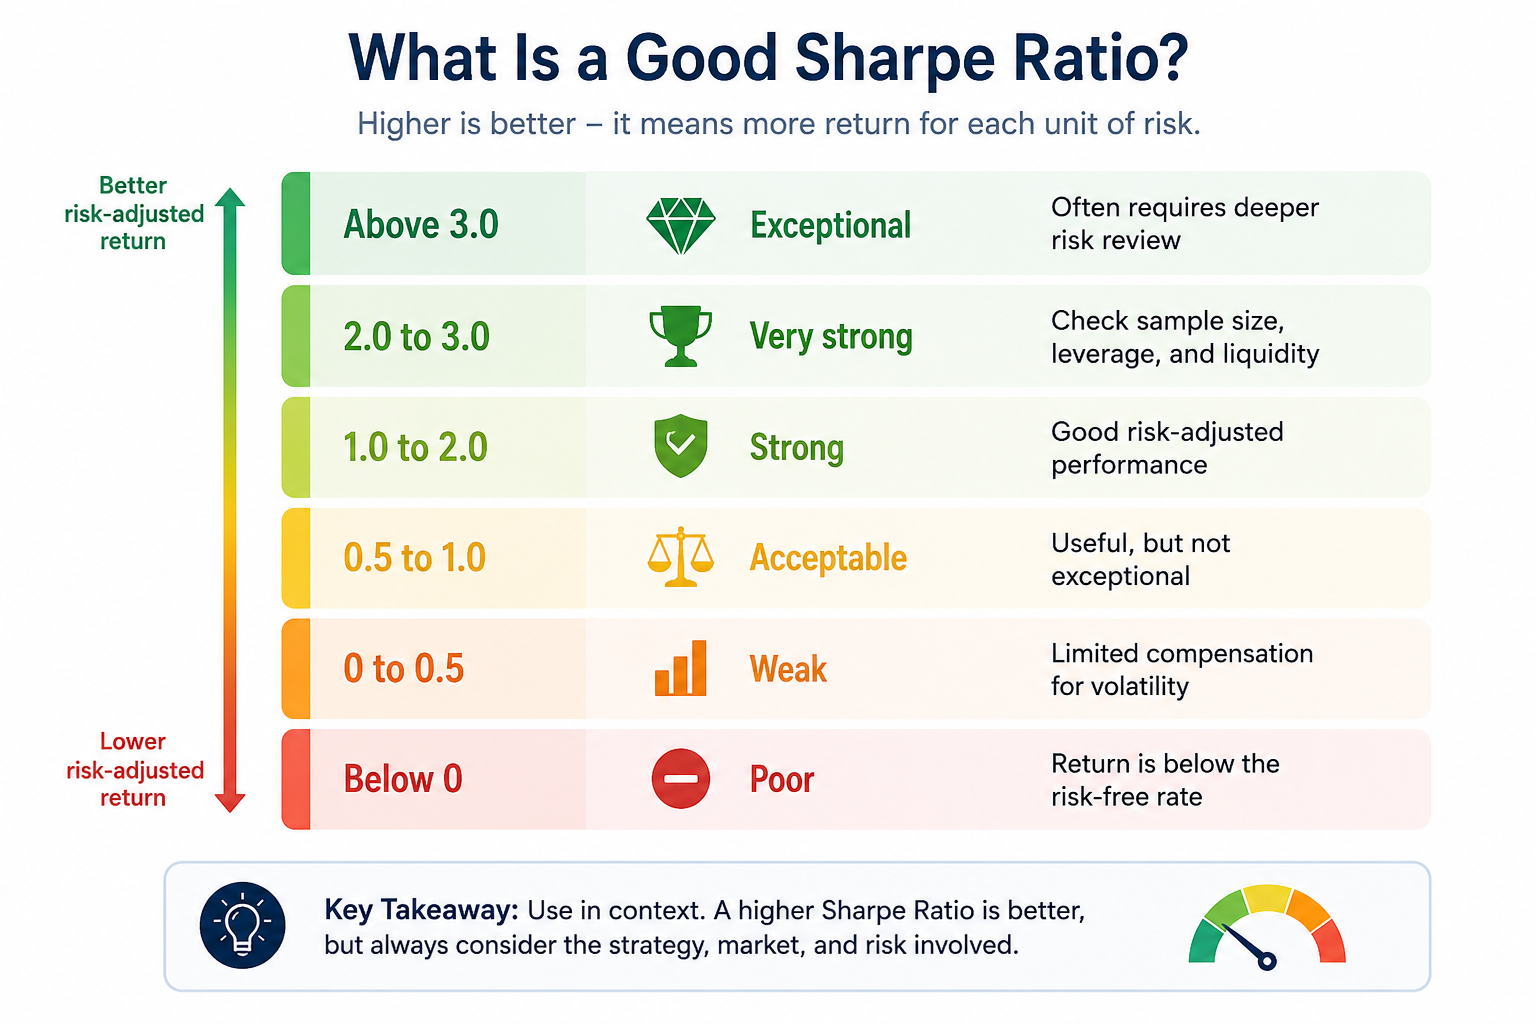
There is no universal threshold, but investors often use the following ranges.
The same Sharpe Ratio can mean different things depending on the asset class and market environment.
Sharpe above 1.0 is generally considered strong.
Sharpe above 2.0 is often viewed as exceptional.
Hedge funds may target higher Sharpe Ratios because their returns are usually smoother.
Equity strategies often exhibit lower Sharpe ratios due to market volatility.
Very high Sharpe Ratios should also be questioned. They may reflect a short sample period, smoothed pricing, leverage, or hidden tail risk.
Compare funds with similar objectives.
Evaluate portfolio efficiency
Measure diversification benefits
Judge whether returns justify volatility.
Review managers across consistent time periods.
For example, two global equity funds may have similar returns, but the one with the higher Sharpe Ratio has usually delivered smoother excess returns.
Evaluate trading strategies
Compare systems over long samples.
Measure return consistency relative to volatility.
Combine with drawdown, slippage, and profit factor.
Test whether a strategy has a durable risk-adjusted edge.
The Sharpe Ratio is not a buy or sell signal. For traders, it is better used to evaluate performance across many trades than to decide whether to enter a single position.
A Sharpe Ratio can be artificially inflated through:
Short measurement periods
Excessive leverage
Smoothed or infrequent pricing
Hidden tail risk
Selective reporting periods
A strategy may appear stable because prices are not marked frequently or because losses have not materialised during the measured period.
This is why investors should also examine:
Rolling returns
Maximum drawdown
Liquidity
Return distribution
Fees and trading costs
Comparing different periods: A one-year Sharpe Ratio should not be compared directly with a five-year Sharpe Ratio. Market conditions can change sharply between periods.
Using the wrong risk-free rate: A U.S. Dollar portfolio should use a U.S. Dollar benchmark. Euro and sterling portfolios should use suitable local equivalents.
Treating Sharpe as a complete risk measure: The Sharpe Ratio measures volatility, not the severity of losses. It does not show whether losses were shallow and frequent or rare and severe.
Ignoring fees and costs: Commissions, spreads, financing costs, fund charges, and taxes can materially reduce risk-adjusted performance.
Comparing unrelated assets: A bond fund, an equity fund, a hedge fund, and a crypto strategy should not be ranked by Sharpe Ratio alone. Their liquidity, volatility, and drawdown profiles are too different.
It treats upside and downside volatility equally.
It assumes standard deviation captures risk well.
It can underestimate tail risk.
It may overstate the stability of illiquid assets.
It is highly sensitive to the chosen time period.
These limitations matter most in strategies with uneven return patterns. Options strategies, leveraged products, private credit, crypto assets, and hedge funds may show attractive Sharpe Ratios until a large loss appears.
Low reported volatility can also reflect infrequent pricing rather than genuine stability. A private asset priced monthly may look smoother than a liquid ETF priced every second.
Investors should compare the Sharpe Ratio with the maximum drawdown, the Sortino Ratio, the Calmar Ratio, beta, liquidity analysis, and rolling return data.
Investors use several risk-adjusted return measures because each captures a different type of risk.
| Ratio | Risk Measure | Best Used For |
|---|---|---|
| Sharpe Ratio | Total volatility | Comparing broad portfolios, funds, and strategies |
| Sortino Ratio | Downside volatility | Evaluating strategies where downside risk matters most |
| Treynor Ratio | Market beta | Comparing diversified portfolios against a benchmark |
The Sortino Ratio focuses only on downside volatility, which many investors consider a more realistic measure of risk because upside volatility is generally not viewed as harmful.
The Treynor Ratio is more relevant when market beta is the main risk factor. For most investors, the Sharpe Ratio remains the easiest starting point because it is simple, widely used, and easy to compare.
The Sharpe Ratio tells you how much excess return an investment generated for each unit of volatility. It helps investors judge whether returns came from efficient risk-taking or simply from accepting larger swings.
Subtract the risk-free rate from the portfolio return, then divide the result by standard deviation. For example, if return is 12%, the risk-free rate is 3.6%, and volatility is 10%, the Sharpe Ratio is 0.84.
A Sharpe Ratio above 1.0 is generally considered strong. A ratio above 2.0 is very strong, but investors should check the sample period, leverage, liquidity, and drawdown risk before relying on the number.
The risk-free rate is the return investors can earn without taking meaningful market risk. When that rate rises, risky assets must deliver higher returns to justify their volatility.
Yes. A negative Sharpe Ratio means the investment returned less than the risk-free rate or generated negative excess return. This can happen even when the investment has a positive return.
Neither is always better. The Sharpe Ratio measures return against total volatility. The Sortino Ratio focuses only on downside volatility, which can be useful when investors care more about losses than upside swings.
Yes, but mainly for strategy evaluation. Traders can use it to assess whether a system produces consistent returns relative to volatility. It should be combined with drawdown, execution cost, trade frequency, and position sizing.
The Sharpe Ratio answers one important question: was the return worth the risk?
It does not answer every question. Investors should also consider drawdowns, downside risk, liquidity, costs, and market conditions before deciding whether performance was truly attractive.
That matters most when cash yields are meaningful. A positive return is not enough if a low-risk alternative offers similar compensation with far less volatility.
Disclaimer: This material is for general information purposes only and is not intended as (and should not be considered to be) financial, investment, or other advice on which reliance should be placed. No opinion given in the material constitutes a recommendation by EBC or the author that any particular investment, security, transaction, or investment strategy is suitable for any specific person.