Crude oil trading remains one of the most dynamic and influential areas of global finance, attracting traders who seek to profit from its volatility and long-term price trends. Success in this market demands more than simply reacting to price moves; it requires a structured approach that blends fundamental analysis, technical tools, and disciplined risk management.
A well-defined trading strategy can transform the uncertainty of sharp price swings into opportunity, guiding traders through the noise of headlines, supply shifts, and geopolitical tensions. By combining practical techniques with tested indicators and scenario-based planning, traders can build the confidence and resilience needed to navigate the complexities of the energy market.
Market Structure & Instruments
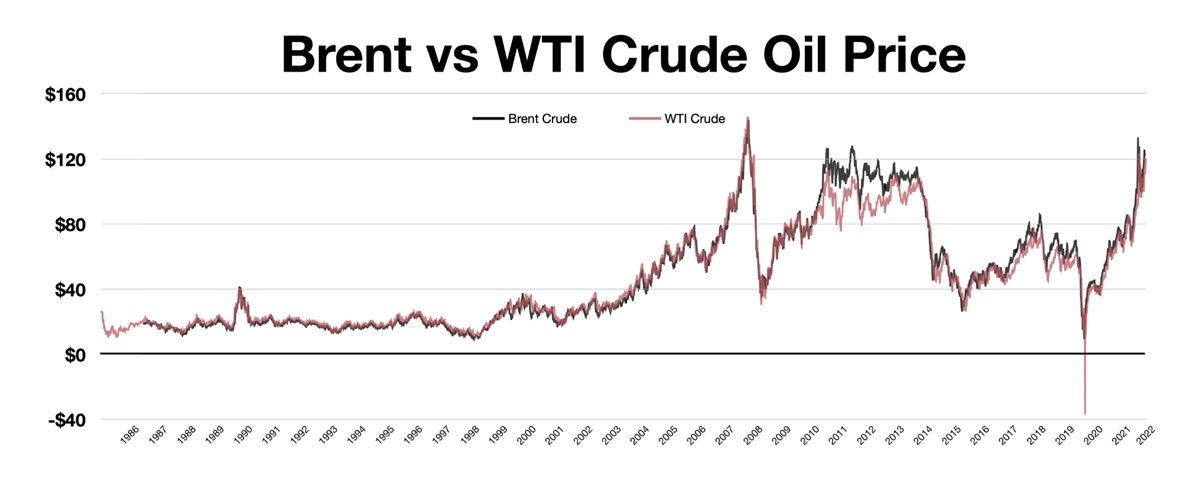
Before trading, one must grasp the instruments available:
WTI (West Texas Intermediate) — U.S. light, sweet crude, traded on NYMEX.
Brent crude — global reference price, traded on ICE.
Price spreads (WTI–Brent) sometimes widen or narrow due to transport costs, supply bottlenecks, or demand differences.
Futures contracts (1.000 barrels each) — high liquidity, exchange-traded, ideal for directional plays.
Options — used to hedge volatility or play directional bias with defined risk.
CFDs — flexible for smaller accounts, margin-friendly.
Oil ETFs — useful for longer-term investors who prefer not to manage futures rollovers.
Example: A trader bullish on Brent may go long ICE Brent futures. Another may use CFDs for smaller capital exposure, while a risk-averse trader may buy call options instead.
What Moves Oil: Key Fundamental Drivers
Crude oil prices are constantly shifting under the influence of supply, demand, and geopolitics.
OPEC+ quotas — production cuts often trigger bullish moves.
U.S. shale — sudden increases in output add downward pressure.
Inventories — EIA and API weekly data act as near-term catalysts.
Global GDP growth — more industrial activity = higher oil consumption.
Seasonal demand — gasoline demand peaks in summer; heating oil in winter.
Wars in oil-producing regions (e.g., Middle East) often spark price spikes.
Sanctions — restrictions on Russia, Iran, or Venezuela constrain supply.
Scenario Example:
On a Wednesday, EIA reports a larger-than-expected draw in U.S. crude inventories. Oil jumps $2 within hours, as traders read it as tightening supply. A short-term trader could catch this move by going long futures right after the release, with a stop-loss below pre-news support.
Choosing Your Venue & Session Timing
WTI on NYMEX, Brent on ICE. Both are most liquid during U.S. and European sessions.
Highest liquidity overlaps occur between 1pm–5pm GMT (London–New York overlap).
Asian hours are thinner, creating larger slippage but also potential for breakouts.
Tip: Day traders often prefer trading during U.S. inventory releases (Wednesdays at 15:30 GMT) when volume and volatility surge.
Technical Baseline: Identifying Trends & Key Levels
Technical analysis offers the structure to time entries and exits:
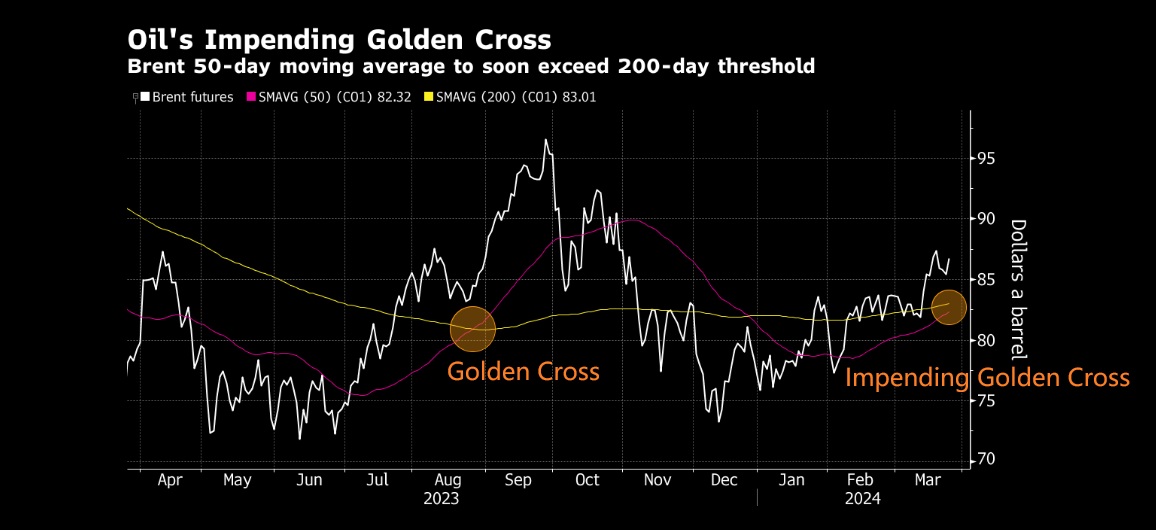
A simple system uses the 50-day and 200-day moving averages.
A "Golden Cross" (50-day crossing above 200-day) often signals bullish continuation.
Example chart scenario: In mid-2020. WTI's 50-day crossed the 200-day as demand recovered post-COVID, triggering a multi-month rally.
Identify horizontal support and resistance zones.
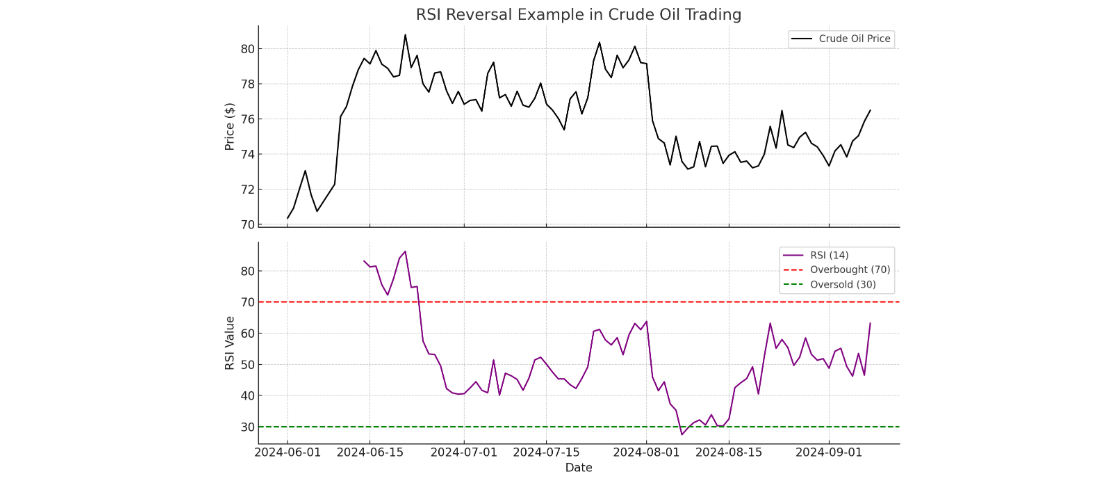
Oscillators like RSI help confirm reversals.
Scenario: Oil bounces repeatedly between $70 and $75. A range trader shorts near $75 with RSI > 70. targeting $71–72.
Use Bollinger Bands or ATR to track volatility.
A Bollinger Band squeeze often precedes major moves.
Scenario: WTI compresses near $78. Bollinger Bands tighten. A breakout above $79 with high volume could unleash a trend move to $82+.
Risk & Trade Management
The oil market can swing $3–5 in a single session, making risk management paramount.
Risk only 1–2% of account equity per trade.
For a $50.000 account, risking 1% = $500. If using futures, one $1 move in oil = $1.000 per contract. Thus, a trader should size down to manage risk.
Logical stop placement: beyond recent swing highs/lows or ATR multiples.
Partial profit-taking improves consistency.
Buy protective puts if holding long futures through risky events (e.g., OPEC meetings).
Scenario: A trader longs WTI at $80. stop at $78. target $85. If volatility rises ahead of OPEC, they may also buy a short-dated $78 put to limit overnight gap risk.
Playbook to Execution: From Concept to Journal
To trade consistently, follow a structured approach:
Review fundamental calendar (EIA, OPEC, Fed statements).
Check overnight news (Middle East conflict, pipeline outages).
Identify major technical levels on 1-hour and daily charts.
Align with trend and key moving averages.
Example: Brent is trending upward, RSI supportive, EIA expected to show draw. Setup = long above $85 breakout.
Enter at trigger, set stop-loss ($83.50), target ($88).
Trail stop to breakeven if price reaches $86.
Scale out half at $87. let remainder run.
Journal: Did you follow your plan? Were fundamentals aligned? Did execution discipline hold?
Variant Strategies for Experienced Traders
Trade the spread between Brent and WTI. If WTI trades $5 below Brent and U.S. supply tightens, the spread may narrow.
Traders can go long WTI, short Brent simultaneously.
Focus on $0.20–$0.40 moves using 1-minute charts during inventory releases.
Requires tight risk control and fast execution.
Ahead of OPEC or U.S. CPI releases, implied volatility surges.
Traders may buy straddles (long call + long put) to profit from sharp moves regardless of direction.
Conclusion
Crude oil trading requires a balance of fundamental awareness, technical structure, and disciplined risk management. By combining multi-factor drivers with a structured playbook, traders can filter noise and focus on high-probability opportunities.
Disclaimer: This material is for general information purposes only and is not intended as (and should not be considered to be) financial, investment or other advice on which reliance should be placed. No opinion given in the material constitutes a recommendation by EBC or the author that any particular investment, security, transaction or investment strategy is suitable for any specific person.
