Published on: 2025-07-14
Updated on: 2025-07-14
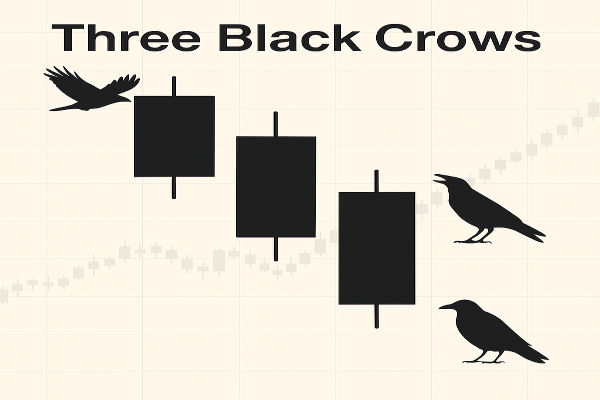
Candlestick patterns are crucial in helping traders predict price movements. Among these, the Three Black Crows pattern stands out as a powerful bearish reversal indicator.
Recognising and interpreting this pattern correctly can offer traders a significant advantage when attempting to time the market, especially after a bullish rally.
In this guide, you'll learn what the Three Black Crows pattern is, how it forms, what it signals, and how you can integrate it into a trading strategy. Let's dive deep into its structure, psychology, examples, and use in modern markets.

The Three Black Crows is a bearish candlestick pattern consisting of three consecutive long-bodied red (or black) candles. Each of these candles opens within the previous candle's body and closes lower, creating a staircase-like pattern that suggests increasing bearish control.
This pattern usually emerges after an uptrend or during an overbought condition. Its appearance may indicate that the bulls are losing steam and that a potential reversal to a downtrend is on the horizon.
For a proper Three Black Crows pattern to form, it must fulfil the following conditions:
There must be an existing uptrend or bullish momentum before the pattern's appearance.
The pattern must consist of three consecutive bearish candles, each with a long real body.
Each candle should open within the previous candle's body but close lower than the last close.
Shadows (wicks) on the candles should be minimal, indicating strong selling pressure throughout the session.
This formation tells traders that sellers are in control for three straight sessions and that buyers have failed to counter the downward momentum.
In Forex
Major currency pairs like EUR/USD or GBP/JPY often exhibit this pattern during trend reversals. Forex traders may use it alongside Fibonacci retracement levels to confirm entries.
In Commodities
Commodities like gold and crude oil frequently experience strong directional moves. When the Three Black Crows pattern appears on daily charts, it can precede massive price drops, especially when economic data shifts sentiment.

The effectiveness of the Three Black Crows pattern increases under certain market conditions. These include:
After a strong bullish rally: The pattern becomes more credible when it follows an extended uptrend.
During overbought conditions: When supported by technical indicators like RSI or Stochastic showing overbought levels, the signal strengthens.
In the absence of major support levels nearby: If there are no significant support zones immediately below the pattern, the potential for further decline is higher.
When confirmed by volume: High trading volume during the formation suggests institutional selling and confirms the strength of the reversal.

Step 1: Confirm the Existing Uptrend
Before acting on the pattern, ensure it appears after a visible uptrend. It gives context to the reversal signal and improves the pattern's reliability.
Step 2: Identify the Three Candles
Look for three consecutive bearish candles, each with a lower close than the previous and opening within the last body. Ensure they are relatively long and lack significant lower shadows.
Step 3: Wait for Confirmation
A prudent approach is to wait for an additional bearish candle after the Three Black Crows. This fourth candle confirms that the downward momentum is continuing.
Step 4: Use Technical Indicators
Combine the pattern with indicators such as:
Relative Strength Index (RSI): A reading above 70 before the pattern forms suggests overbought conditions.
MACD crossover: A bearish crossover after the pattern increases conviction.
Volume spikes: Increased volume during the pattern adds strength to the signal.
Step 5: Set Entry and Exit Points
Once confirmed, you can:
Enter a short position below the low of the third crow or the confirming candle.
Place a stop-loss above the high of the first crow to limit risk.
Set a take-profit level based on previous support levels, Fibonacci retracements, or risk-reward ratios.
Let's consider a hypothetical example with a tech stock like Nvidia (NVDA) that has been in a strong uptrend due to positive earnings and AI momentum.
After a period of bullish run, the stock forms three long bearish candles:
The first bearish candle opens near the top and closes deep in red.
The second candle opens slightly within the first and closes lower.
The third follows suit with a similar structure.
RSI shows overbought, and MACD lines cross downward. The pattern suggests that the rally may be over. A fourth bearish candle appears the next day, confirming the trend shift. Traders then enter short positions targeting a correction toward the 50-day moving average.
Additionally, the Three Black Crows is most reliable on higher timeframes such as daily or weekly charts. On intraday charts (like 15-minute or 1-hour), it may produce noise and result in premature entries.
Swing traders and position traders benefit most from using this pattern in combination with other technical tools.

False Signals
Not every instance of three bearish candles qualifies as the Three Black Crows pattern. Some traders mistake regular pullbacks as trend reversals. To avoid false signals:
Always ensure it follows a strong uptrend.
Look for consistent candle length and small wicks.
Confirm using volume and indicators.
Mini-Crows
Sometimes, the pattern appears with shorter candles due to low volatility. These "mini-crows" may not carry the same conviction and should be treated cautiously.
Sideways Market Trap
In a ranging market, this pattern can form without an actual trend direction. Trading it in such conditions can lead to whipsaws.
New traders looking to implement this pattern should follow these tips:
Practice identifying the pattern on demo accounts before trading live.
Use backtesting tools to evaluate its performance in different market conditions.
Combine with trend indicators like the 50-day or 200-day moving average for enhanced reliability.
Always define your stop-loss and risk-reward ratio before entering a trade.
In addition, avoid using this pattern in certain conditions:
Low volume environments: Thinly traded stocks may form the pattern due to noise rather than real sentiment.
Consolidation phases: If the pattern occurs within a sideways range, it lacks context for a true reversal.
Near strong support zones: Price may bounce quickly after forming the pattern if key support levels are nearby.
In conclusion, candlestick patterns remain a cornerstone of technical analysis, and the Three Black Crows pattern is among the most respected bearish signals available. It tells a clear story of seller dominance and potential trend reversal.
Mastering patterns like the Three Black Crows takes time and repetition, but they can become powerful allies in your trading journey when paired with risk management and patience.
Disclaimer: This material is for general information purposes only and is not intended as (and should not be considered to be) financial, investment or other advice on which reliance should be placed. No opinion given in the material constitutes a recommendation by EBC or the author that any particular investment, security, transaction or investment strategy is suitable for any specific person.


World's Best Broker