Published on: 2025-08-13

Price action trading is a method of analysing and making decisions in the markets based solely on the movement of price over time. It strips away technical indicators and focuses directly on how buyers and sellers interact. Traders using this approach interpret price movements through patterns, market structure, and recurring behaviours, rather than relying heavily on derived metrics.
Unlike indicator-based strategies, price action trading relies on the idea that all necessary information is already reflected in the price. This makes it highly adaptable to different markets, from foreign exchange and stocks to commodities and cryptocurrencies.

At its core, price action trading hinges on understanding the battle between supply and demand. Every price movement represents a shift in this balance:
Higher highs and higher lows indicate bullish momentum.
Lower highs and lower lows suggest bearish momentum.
Consolidation zones show indecision or equilibrium between buying and selling pressure.
Candlestick charts are the most common visual tool for price action traders, as they display the open, high, low, and close within a given period — all the essential data without distraction.
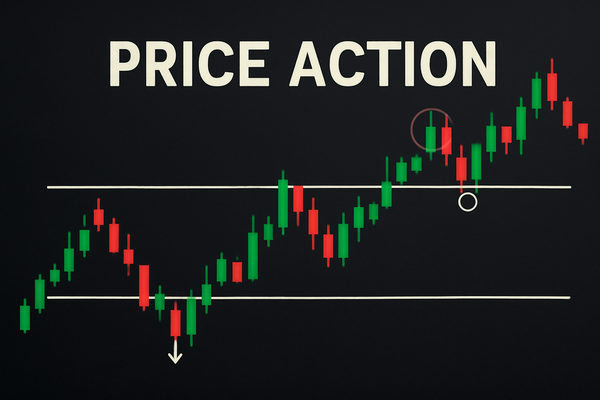
Recognising the underlying structure of the market is crucial. Price action traders often:
Identify support and resistance zones where price has repeatedly reversed or paused.
Mark trendlines to visualise the prevailing direction.
Use swing highs and swing lows to determine market phases.
Understanding whether the market is trending, consolidating, or reversing helps traders choose suitable strategies and manage expectations for potential trade outcomes.

Price action trading often involves recognising repeating formations that signal possible market moves. These include:
Pin bars: Candles with long wicks showing rejection of a price level.
Inside bars: Periods of consolidation signalling potential breakout setups.
Breakouts: Price moving beyond established support or resistance zones.
Engulfing patterns: Candles that fully absorb the range of the previous candle, suggesting a strong shift in momentum.
The context in which these patterns appear is as important as the patterns themselves. A pin bar at a major support level carries different weight from one in the middle of a range.
Price action analysis can be applied across all timeframes, but the strategy and level of detail vary:
Short-term traders might focus on 1-minute to 15-minute charts for quick scalps.
Swing traders typically watch 4-hour or daily charts for more deliberate setups.
Position traders use weekly and monthly charts for long-term perspectives.
Execution involves waiting for the market to align with the trader's predefined conditions — patience is key. Jumping in without confirmation often leads to lower-probability trades.
Advantages:
Clear and uncluttered chart view.
Flexibility to adapt across markets and timeframes.
Direct insight into real-time market sentiment.
Drawbacks:
Requires strong discipline and chart-reading skills.
Subjectivity can lead to inconsistent results for beginners.
May be less effective during extremely low-volatility periods.

Imagine you're watching a daily chart of a major Forex pair, say EUR/GBP:
Draw your levels: There's a clear descending resistance trendline and a horizontal support around 0.8400.
Price pulls up, touches the descending trendline, forms a bearish engulfing candle—a reversal signal.
Entry: Sell order just below the engulfing candle.
Stop: Above the high of the engulfing pattern (just beyond the trendline).
Target: Aim toward the horizontal support zone at 0.8400—providing a strong R:R.
If the pair breaks above, invalidating the setup, you simply exit as per your stop.
This blend of structural levels, price signal, and disciplined entry/exit is the magic of price action.
Price action trading is not about predicting the future with absolute certainty but about stacking probabilities in your favour by reading the market's own language. By mastering price behaviour, traders can simplify their charts, sharpen their decision-making, and gain a clearer view of market sentiment. Whether used alone or alongside other tools, price action remains one of the most timeless and adaptable trading approaches.
Disclaimer: This material is for general information purposes only and is not intended as (and should not be considered to be) financial, investment or other advice on which reliance should be placed. No opinion given in the material constitutes a recommendation by EBC or the author that any particular investment, security, transaction or investment strategy is suitable for any specific person.