Published on: 2025-05-06
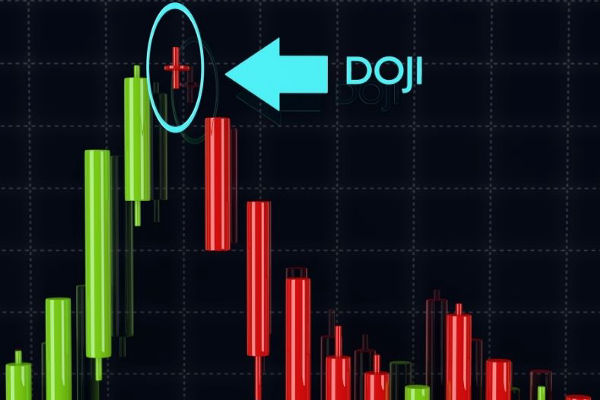
Candlestick patterns are among the most powerful tools in a trader's technical analysis toolkit. One such pattern that stands out for its simplicity and potential accuracy is the Dragonfly Doji.
But can the Dragonfly Doji really predict the next trading move? Let's take a closer look at what it represents, how it forms, and why it's so closely watched by traders aiming to time the market effectively.

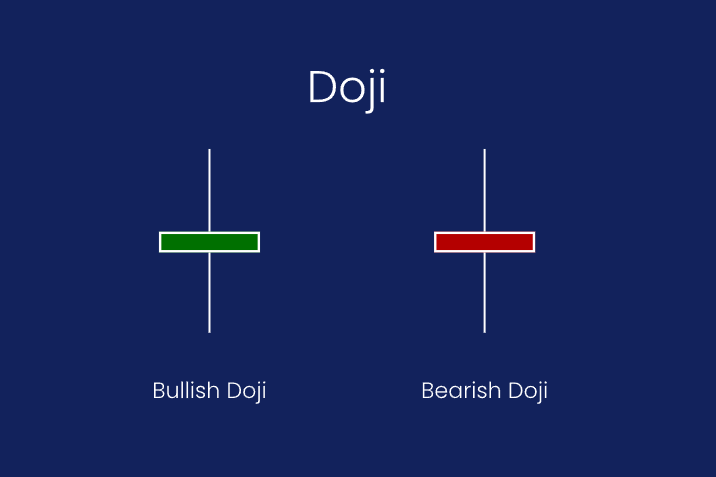
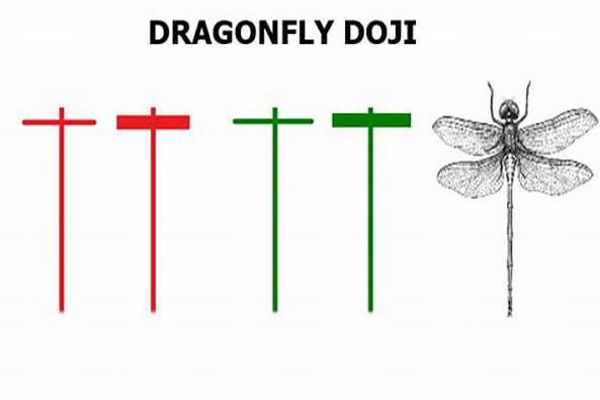
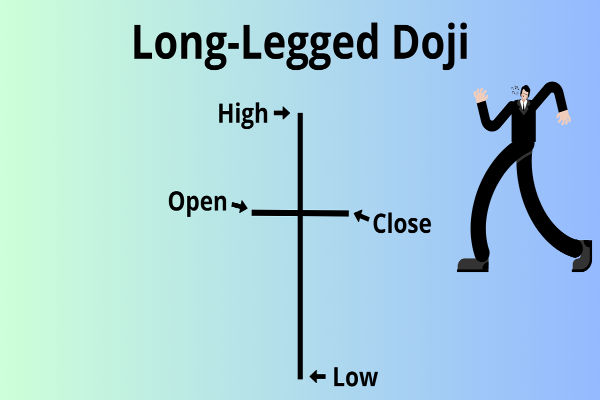
The Dragonfly Doji is a candlestick pattern that forms when the open, high, and close prices are virtually equal, and there's a long lower shadow. This means that although the price dropped significantly during the trading session, it recovered completely by the end, closing near the opening price. The result is a candle that resembles a “T” shape.
The Dragonfly Doji appears less frequently than other patterns, but when it does, it can provide key insights into the psychology of the market. It often indicates a potential reversal, particularly when it forms after a downtrend.
The Dragonfly Doji is valued for its potential to mark turning points. When seen after a sustained downtrend, it signals that sellers dominated the session but were ultimately overtaken by buyers. This balance shift may suggest that bearish momentum is waning, and a reversal or consolidation could be on the horizon.
It's important to note that while the Dragonfly Doji is a helpful signal, it is not a guarantee. It should always be confirmed with other technical indicators or candlestick formations before making a trading decision.
A Dragonfly Doji does not act in isolation. Its meaning can change depending on market conditions and its position relative to support and resistance levels.
After a downtrend: This is the most widely accepted context where a Dragonfly Doji is considered bullish. It implies that selling pressure might be exhausted.
During an uptrend: If it appears at the top of an uptrend, it could signal a potential pause or even a reversal. However, this is less common and should be treated with caution.
In sideways markets: It may indicate indecision or a temporary pause, and its predictive power is usually weaker.

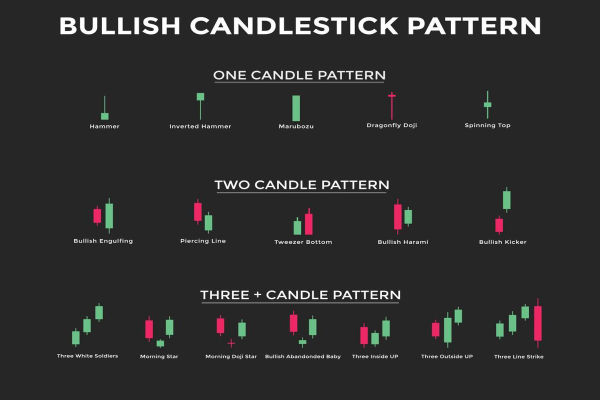
The Dragonfly Doji is often compared to the Hammer candlestick because both have long lower shadows and small bodies. However, while a Hammer has a small real body above the low, the Dragonfly Doji has virtually no body at all.
This distinction makes the Dragonfly Doji a purer form of reversal signal. It tells traders that buyers completely reversed the downward move, bringing the price back up to its open by the close of the candle.
To incorporate the Dragonfly Doji into a trading strategy, consider the following steps:
Identify the pattern after a clear downtrend. Look for the characteristic T-shape, with a long lower wick and no upper shadow.
Confirm with volume. A Dragonfly Doji formed on high volume is often more reliable than one with low volume.
Use supporting indicators. Tools like RSI, MACD, or trendlines can provide confirmation of a potential reversal.
Set risk-managed entries. Traders often wait for the next candle to close above the high of the Dragonfly Doji to enter a trade.
Define stop-loss and take-profit levels. Place stops just below the low of the Dragonfly Doji and set profit targets based on prior resistance levels or risk-reward ratios.
Imagine a stock has been in a downtrend for two weeks. On a Wednesday, it opens at £100, drops to £92 during the session, but closes again at £100. The result is a Dragonfly Doji.
On Thursday, the price opens at £101 and continues rising. Traders who identified the pattern, confirmed it with increased volume and perhaps a rising RSI, could have entered at £101 with a stop at £91, setting a target at the next resistance level, say £110.
While the Dragonfly Doji is visually striking and potentially informative, it is not foolproof. Here are some of its limitations:
It can occur in low-volume environments where price action is more erratic and less meaningful.
On shorter timeframes, false signals are more common.
Without confirmation from other tools or market context, the signal can be misleading.
This highlights the importance of using the Dragonfly Doji as part of a broader strategy rather than relying on it as a standalone tool.
The Dragonfly Doji is a compelling pattern for traders looking to anticipate market reversals. When interpreted in the right context and supported by other indicators, it can offer early entry signals with a favourable risk-to-reward ratio.
However, like all candlestick patterns, it requires confirmation and careful consideration of the broader market picture. No signal is perfect, but used wisely, the Dragonfly Doji can become a valuable part of your trading arsenal.
Disclaimer: This material is for general information purposes only and is not intended as (and should not be considered to be) financial, investment or other advice on which reliance should be placed. No opinion given in the material constitutes a recommendation by EBC or the author that any particular investment, security, transaction or investment strategy is suitable for any specific person.