Published on: 2023-12-26
Updated on: 2026-04-29
Support and resistance trading looks simple until price breaks a level, triggers stops and reverses without warning. That is why traders need to understand not only the meaning of support and resistance and what they represent in trading, but also how these levels behave in faster, liquidity-driven markets.
The old rule is familiar: buy support, sell resistance. The better rule is more precise: buy support only when buyers defend the zone, sell resistance only when sellers regain control, and avoid acting on the first touch without confirmation.

In 2025 and 2026, this distinction matters more because short-dated options, algorithmic execution and clustered stop orders can intensify intraday moves around obvious levels. SPX zero-days-to-expiry options averaged 2.3 million contracts daily in 2025, representing 59% of total SPX options volume, reinforcing how quickly positioning can affect major index levels.
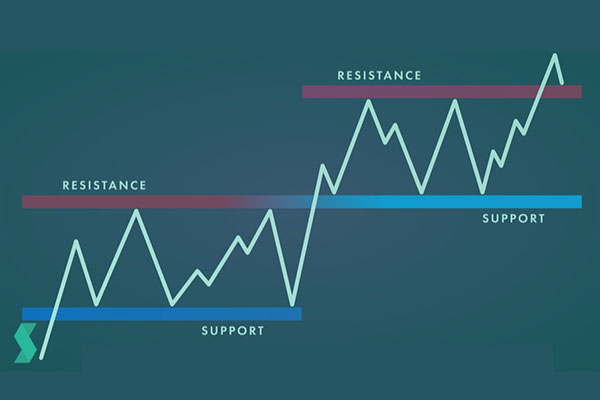
Support and resistance are price zones where market behaviour has changed before and may change again.
Support is an area where buying interest has previously been strong enough to slow or reverse a decline. It can form when investors view price as attractive, short sellers take profit, or algorithms detect demand near a previous low.
Resistance is an area where selling pressure has previously been strong enough to slow or reverse a rally. It can form when existing holders take profit, short sellers enter, or breakout traders hesitate near a prior high.
The keyword is area. Support and resistance are not perfect lines. A stock may react around $100 several times, but one bounce may occur at $99.50 and another at $100.80. That does not make the level useless. It shows that traders are responding to a zone.
In practical terms, support and resistance in trading represent three things: market memory, liquidity and decision pressure. They show where traders previously acted, where stops may be clustered and where the next move may force buyers or sellers to respond.
What does support level mean in stocks? It means the price has reached a level where demand has previously been strong enough to overcome selling pressure.
A support level can appear after a sharp decline, during a pullback in an uptrend, or near a previous breakout level. For example, if a stock breaks above $80, rallies to $92, then later pulls back and holds near $80, that former resistance may become support. This happens because traders who missed the breakout may buy the retest, while earlier short sellers may cover positions.
Strong support usually has three traits. First, the price has reacted there more than once. Second, the zone appears on a meaningful time frame, such as the daily or four-hour chart. Third, the reaction shows evidence of demand through a strong close, rising volume or a failed breakdown.
Weak support is different. A level that has been tested too many times without a strong bounce may be losing strength. Each retest can absorb more buy orders. Once buyers are exhausted, the price can break lower quickly.
What is a resistance level in trading? It is a price zone where supply has previously exceeded demand.
Resistance often forms near prior highs, failed breakout points, moving averages or psychological prices such as $50, $100 or $1,000. In stocks, the resistance stock meaning is simple: it is the area where sellers have previously been willing to act.
A resistance level does not automatically mean the price must fall. This is where many traders make mistakes. Strong markets can pause below resistance, consolidate, then break higher. That is why consolidation below resistance should not be shorted blindly. Tight consolidation near a ceiling may show that sellers are no longer able to push prices down.
A clean breakout above resistance becomes more reliable when price closes above the zone, volume expands, and the next pullback holds the former resistance as support. Without that confirmation, a breakout may simply be a liquidity sweep.
Using support and resistance in trading begins with market conditions. The same level means different things in an uptrend, a downtrend, or a sideways range.
This decision framework is more useful than simply drawing lines on a chart. It forces traders to ask the right question: who is in control at this level?
A stock support-and-resistance website or charting platform can help identify obvious zones, but traders should still verify levels manually. Automated levels often mark the same prices that many other traders see, which can make them useful but crowded. Crowded levels attract stop orders, fakeouts and fast reversals.
The phrase buy support, sell resistance works best in a sideways market. If the price repeatedly moves between a support and a resistance zone, traders may look to buy near the lower boundary and sell near the upper boundary.
For example, assume a stock trades between $95 support and $110 resistance for several weeks. If the price falls toward $95, rejects the zone and closes back above $97, buyers have shown defence. A trader may consider a long setup with a stop below the support zone and a target near the middle or top of the range.
If the price rallies to $110, fails to close above it, and forms a lower high, resistance remains active. A trader may consider taking profit, reducing long exposure or looking for a short setup if the broader trend supports it.
The middle of the range is usually the weakest place to trade. The risk-reward is poor because the price is far from both the invalidation and the target. Patient traders wait for the price to reach a decision zone.
Support and resistance fail when the balance of supply and demand changes.
In an uptrend, resistance can break because buyers are willing to pay higher prices. When that happens, shorting resistance becomes dangerous. The better trade may be waiting for a retest of the broken level.
In a downtrend, support can break because buyers stop defending the zone. When the price closes below support with strong volume, the old floor may become a ceiling. That failed support can become a short-entry zone if the price retests it from below and stalls.
This is where trend context matters. Buying support in a strong uptrend is often a pullback strategy. Buying support in a clear downtrend may be catching a falling knife. Selling resistance in a downtrend aligns with structure. Selling resistance in a powerful uptrend can become a trap.
A breakout occurs when the price moves beyond support or resistance. A real breakout shows commitment. Price closes beyond the level, volume confirms the move, and the broken zone holds on a retest.
A fakeout is different. Price briefly breaks the level, attracts traders in the wrong direction, then reverses. This often happens around obvious highs and lows because stop orders cluster there.
For longs, a false breakdown below support can be powerful if the price quickly reclaims the zone. It shows that sellers failed to maintain control. For shorts, a false breakout above resistance can be useful if the price falls back below the level and closes weak.
Treating levels as exact prices: Markets move through zones, not ruler-straight lines.
Ignoring the trend: Support in an uptrend and support in a downtrend are not equal. One may offer a continuation setup. The other may be a breakdown waiting to happen.
Shorting every time a resistance touch occurs: If the price keeps pressing against resistance without falling, sellers may be weakening.
Placing stop losses exactly where everyone else places them: Stops directly below support or above resistance are vulnerable to liquidity sweeps.
Trading without a target: Every setup should have a defined entry, an invalidation point, and a profit zone before execution.
Support and resistance are price zones where buyers or sellers have acted with sufficient force to change the price direction. Support shows potential demand. Resistance shows potential supply. Traders use both to plan entries, exits, stop losses and profit targets.
A support level in stocks means the price has reached an area where buyers have previously entered, or sellers have taken profit. It does not guarantee a bounce. Traders should confirm support with price reaction, volume, trend structure and candle closes.
A resistance level is a zone where selling pressure has previously slowed or stopped a rally. It may act as a profit-taking area, a short-entry zone or a breakout trigger if buyers push the price through it with strength.
It depends on market conditions. In a range, buying support and selling resistance can work well. In an uptrend, buying support is usually stronger. In a downtrend, selling resistance is usually cleaner. Trend context decides the quality of the setup.
Yes. When support breaks, traders who bought near that level may sell if the price retests it. This can turn old support into new resistance. The same logic works in reverse when resistance breaks and later becomes support.
Support and resistance trading remains valuable because it gives structure to price movement. It shows where traders have acted before, where liquidity may sit and where risk can be defined.
The best traders do not buy support or sell resistance mechanically. They read the level, confirm the reaction and respect the broader trend. A strong level creates a location. Price action creates the signal. Risk management decides whether the trade is worth taking.
Disclaimer: This material is for general information purposes only and is not intended as (and should not be considered to be) financial, investment or other advice on which reliance should be placed. No opinion given in the material constitutes a recommendation by EBC or the author that any particular investment, security, transaction or investment strategy is suitable for any specific person.