Published on: 2025-08-14
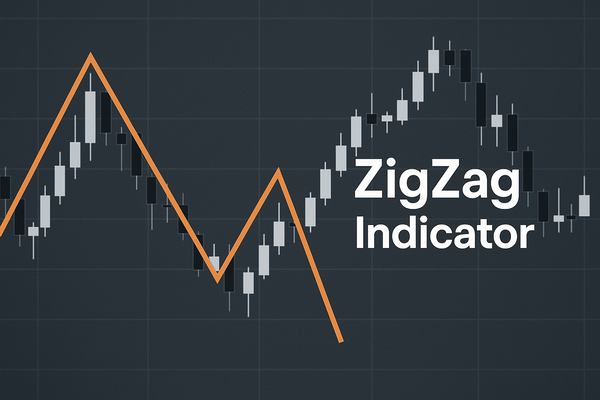
The ZigZag indicator is a favourite among traders who prefer clean, clutter‑free charts. By ignoring small and insignificant price moves, it connects only the most meaningful highs and lows, making trends, reversals, and patterns much easier to see. This filtering effect helps traders focus on big-picture structure while avoiding the distraction of every minor tick.
However, the ZigZag is not a crystal ball. It is a mapping tool, best used alongside confirmation methods and proper risk management. Let's explore how it works, how to set it up, and ways to use it effectively in real trading.

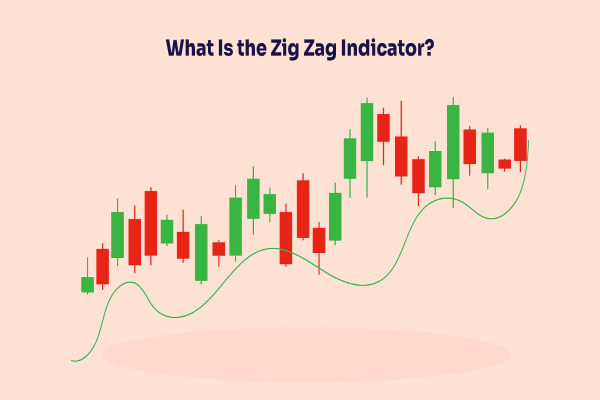
At its core, ZigZag simplifies price action. It highlights major swings, removes noise, and makes trend structure easier to read. This clarity helps in:
Identifying the prevailing trend
Spotting chart patterns like double tops/bottoms or head and shoulders
Marking support and resistance based on past swing highs and lows
Reviewing past price behaviour without distractions from micro-movements
Unlike moving averages or oscillators, ZigZag is not predictive — the most recent swing can change until confirmed. Traders should treat the last leg with caution.
The indicator's performance depends largely on three settings:
Depth – Minimum number of candles before a pivot is confirmed. A higher depth means fewer pivots and less noise.
Deviation – The minimum percentage change in price required to create a new leg. A small deviation produces more lines; a larger deviation focuses on only the biggest moves.
Backstep – The minimum number of candles between two pivots to prevent them from clustering too close together.
Typical starting points:
Intraday trading: Depth 12–20 | Deviation 3–5% | Backstep 3–5
Swing trading: Depth 24–48 | Deviation 5–10% | Backstep 5–8
For highly volatile instruments, increase Backstep to reduce whipsaws.
On MT4 or MT5:
Open your trading chart.
Go to Insert → Indicators → Custom → ZigZag.
Adjust Depth, Deviation, and Backstep to suit your market and timeframe.
Save the template for consistency across charts.

The ZigZag's straight lines guide you in recognising:
Trend direction: Higher highs and higher lows = uptrend; the opposite indicates a downtrend.
Pullbacks and impulses: Compare leg sizes. Strong moves with shallow pullbacks show trend strength.
Key levels: Past swing highs/lows can be used for stops and targets.
It's even more effective when you use a higher timeframe ZigZag for market bias and a lower timeframe ZigZag for fine-tuning entries.
1. Trend Pullback Continuation
First, confirm a strong uptrend or downtrend through a sequence of swings. Wait for a corrective leg to form, then look for a momentum signal — such as RSI turning back in the trend's favour — before entering in that direction. Stops should go beyond the last corrective swing, with targets near prior swing highs or lows.
2. Reversal at Structure
Mark major past swings and look for the price to test these areas. If the swing fails to extend and shows divergence or strong rejection, consider a reversal trade. Enter on a break in the opposite direction with stops beyond the failed swing.
3. Fibonacci Levels with ZigZag
Once two ZigZag points define a leg, apply Fibonacci retracements and projections to identify possible retracement levels and profit targets.
Good risk control means:
Placing stops just beyond the last confirmed pivot
Position sizing so risk per trade remains consistent
Adjusting settings for higher volatility conditions
Avoiding trades right before high-impact news events
By tying stop placement and targets to swing structure, trades are aligned with actual market behaviour.
Some traders misuse ZigZag as a direct entry trigger. Others over-optimise settings for past performance, only to find they fail in changing market conditions. The biggest error is acting on an unfinished ZigZag leg — patience is vital.
ZigZag is especially useful after volatile moves, for reviewing and journaling past trades, and for pattern recognition. It works best in trending conditions and on charts where price movement is not too erratic.
Treat ZigZag as a map, not a signal. Combine it with confirmations such as price action or momentum indicators, and it can significantly improve trade filtering and timing.
Disclaimer: This material is for general information purposes only and is not intended as (and should not be considered to be) financial, investment, or other advice on which reliance should be placed. No opinion given in the material constitutes a recommendation by EBC or the author that any particular investment, security, transaction, or investment strategy is suitable for any specific person.