Published on: 2025-09-18
Updated on: 2025-09-18
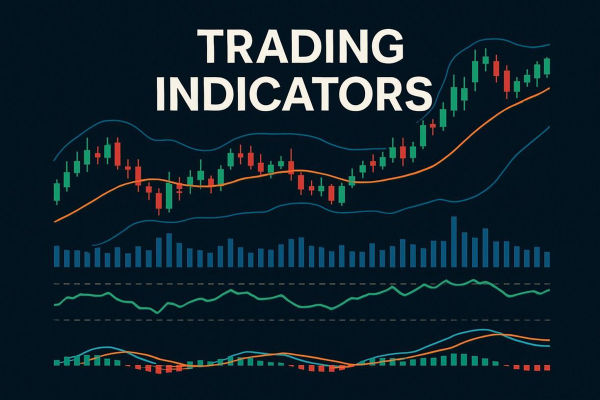
Patterns are an essential part of technical analysis, and Elliott Wave Theory is a key concept that every technical analyst must encounter.
On TradingView, pattern tools can be easily accessed, making wave analysis more efficient and structured.

Elliott Wave Theory describes the cyclical nature of market movements in a highly summarised way.
In a given trend, the structure includes five impulse waves and three corrective waves.
Typically, the impulse waves are labelled 1. 2. 3. 4 and 5. while the corrective waves are marked A, B and C.
Within impulse waves:
Wave 2 cannot fall below the starting point of Wave 1.
The low of Wave 4 must not drop below the peak of Wave 1.
Wave 3 cannot be the shortest among Waves 1. 3 and 5.

On TradingView, the Elliott Wave tool allows users to easily label wave structures and apply theory rules to anticipate future market trends.
Under the Elliott Wave tool:

12345 marks the main impulse waves.

ABC marks corrective waves.

The Elliott Triangle Wave (ABCDE) is an advanced corrective pattern. It reflects sideways movement in corrections, with price fluctuations that gradually contract or expand.
Typically, the triangle forms a 3-3-3-3-3 structure, where each segment is a smaller three-wave pattern, labelled (A), (B), (C), (D) and (E).
In TradingView, this can be annotated directly.

Beyond these, there are also double and triple combination waves.
A double combination wave (W-X-Y) is a mix of two corrective structures, usually a correction + a linking wave + another correction.
A triple combination wave (W-X-Y-X-Z) combines three corrective structures with linking waves in between.
In both combinations:
Corrective waves can take the form of flats or zigzags.
Linking waves may be of any type, though they are often zigzags.
Triangular waves, if present, appear only in the Y wave of a double or the Z wave of a triple.
TradingView provides direct tools to mark these structures as well.

Elliott Wave Theory remains one of the most powerful methods for analysing market structures. Mastery of this tool greatly enhances the ability to understand market trends and anticipate price movements.
Disclaimer: This material is for general information purposes only and is not intended as (and should not be considered to be) financial, investment or other advice on which reliance should be placed. No opinion given in the material constitutes a recommendation by EBC or the author that any particular investment, security, transaction or investment strategy is suitable for any specific person.