Published on: 2025-11-24
Updated on: 2025-11-24
Gold vs the US dollar has cooled after a powerful multi-month rally. Spot XAUUSD is trading near 4,060 USD per ounce on 24 November 2025. inside a tight band between recent lows around 4,040 and intraday highs near 4,080.
Price sits well above the 52-week low near 2,580 and below the recent peak above 4,380. which means gold is still in a strong longer-term uptrend but short-term direction is less clear.
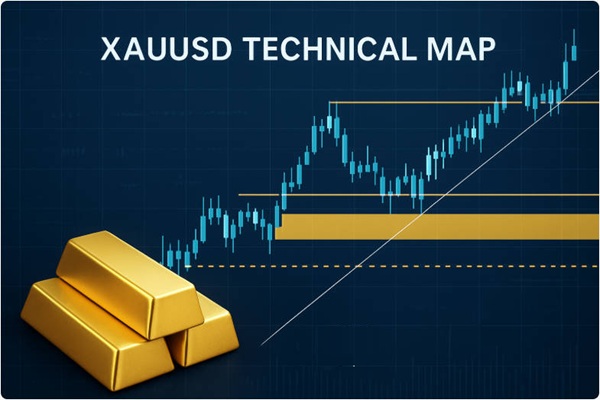
This overview builds a technical map of XAUUSD: trend, momentum, support and resistance zones, and the price areas that traders watch when deciding whether to step in or wait for clearer signals. It is for information only and is not investment advice.
Live spot data from major feeds puts XAUUSD around 4,058-4,060 with a daily move of about -0.2%, after trading between roughly 4,040 and 4,078 during the session.
Over the past month, daily closes have moved from the high 3,900s to just above 4,050. with a spike to 4,244 on 13 November before a sharp pullback. That pattern tells a clear story: strong upside extension followed by consolidation, as buyers and sellers battle around the 4,000-4,100 band.
On a 52-week basis, gold has climbed from around 2,580 to above 4,380 at the highs, a gain of more than 50%, confirming a powerful structural bull trend even if short-term swings stay choppy.
From 18 to 24 November, XAUUSD moved in a relatively narrow but noisy range. Daily closes slipped from about 4,081 to 4,058. a loss of roughly half a percent, with intraday highs between 4,100 and 4,133 and lows near 3,999-4,041.

External analysis also notes repeated rejection above 4,100, confirming that area as a near-term ceiling where supply keeps appearing.
Looking back to late October, gold pushed up from the 3,950-4,000 region into a vertical leg higher, topping in the 4,240 zone in mid-November before snapping back toward 4,000.

That sequence (breakout, acceleration, fast shakeout) often marks the start of a consolidation phase rather than an immediate trend reversal, especially while price holds above the original breakout base around the high 3,900s.
On a six-month view, the picture is dominated by the large rally that lifted gold from the mid-2,000s to above 4,000 per ounce, with the current consolidation happening near the upper end of the 52-week range.

Higher highs and higher lows on the weekly chart remain in place. The question for many traders now is not whether gold has been in an uptrend, but whether this sideways action near 4.000 is a pause before another leg higher or the start of a deeper retracement.
Daily technical analysis gives a useful snapshot.
| Indicator | Value | Bias / Signal | Comment |
|---|---|---|---|
| RSI (14) | 55.7 | Mild bullish | Above 50 but below 70, suggesting positive momentum without extremes. |
| MACD (12,26,9) | 4.56 | Bullish | MACD is above zero with a positive histogram, in line with an uptrend. |
| Stochastic (9,6) | 47.5 | Neutral | Oscillator sits near mid-range, not signalling overbought or oversold. |
| ADX (14) | 24 | Moderate trend | Trend strength is present but not extreme; rallies are not one-way. |
| CCI (14) | 47.2 | Slightly positive | Momentum tilts higher, yet still close to neutral territory. |
| ATR (14) | 18.8 | Elevated volatility | Daily true range around 19 dollars shows sizeable intraday swings. |
| 50-day simple moving average | 4068.7 | Supportive cluster | Sits just above spot, acting as a reference line for the uptrend. |
| 100-day simple moving average | 4069.9 | Supportive cluster | Close to the 50-day, reinforcing the 4,060-4,080 band as a pivot zone. |
| 200-day simple moving average | 4104.7 | Overhead guide | Slightly above current price, marking a broader trendline area. |
RSI above 50. a positive MACD, and CCI just under 50 point to ongoing bullish bias, but not to a stretched market.
ADX in the low 20s confirms that the uptrend is present, yet consolidating rather than accelerating.
The clustering of 50- and 100-day moving averages close to spot price underlines 4,060-4,080 as a key technical "pivot strip" for many swing traders.
Overall, indicators lean modestly positive, while prices oscillate around major averages. That combination often matches a "wait for direction" phase where breakouts from the range matter more than individual oscillator signals.
Weekly reports note bulls defending 4,050, while our forecasts point to deeper support near 3,955 and previous lows just under 4,000.
Repeated rejection above 4,100, and supply closer to 4,135-4,140, mark the upper edge of the current consolidation.
| Zone (USD/oz) | Type | Why it matters |
|---|---|---|
| 4,050-4,030 | Immediate support | Area where recent sell-offs stalled and weekly reports highlight active buyers. |
| 4,000-3,999 | Psychological & swing low | Round number and November intraday low; break below would mark a clearer momentum shift. |
| 3955 | Deeper support | Level flagged by some weekly forecasts as a key retracement target in a pullback scenario. |
| 4,090-4,110 | Near-term resistance | Zone where gold has faced repeated rejection in recent days, capping rallies. |
| 4,135-4,140 | Supply band | Upper part of the current range; highlighted in intraday idea flows as a selling zone. |
| 4,200-4,244 | Major resistance / recent high | Mid-November peak region; a break above would reopen the path toward record territory. |
For our technical analysis, 4,050-4,110 forms the key intraday battlefield. Sustained trade above the upper band would tilt the map back toward trend continuation, while a daily close below 4,000 would shift attention to the 3,955 area and, below that, earlier breakout zones.
Short-term bulls tend to look for:
Daily closes back above 4,100 turning the recent ceiling into support.
RSI holding above 50 with MACD staying positive, confirming that momentum still favours the upside.
Price respecting the 4,050-4,030 floor and bouncing from the 50- and 100-day moving averages.
When those conditions line up, many trend followers continue to treat pullbacks toward support as part of a larger bull structure rather than evidence of a top.
Short-term bears often concentrate on:
A clean daily close below 4,050 and especially a break under 4,000 which would be the first serious test of the recent breakout base.
RSI slipping back toward 50 or below, and MACD flattening or crossing lower, signalling that upside momentum is fading.
Lower highs forming beneath 4,100–4,135 on the 4-hour chart, keeping the market trapped inside a descending short-term channel.
In that environment, some tactical traders prefer to fade strength into resistance, while longer-term participants may simply wait to see whether the deeper support zones near 3.955 and below attract strong demand again.
Without giving a direct buy or sell call, the present structure on XAUUSD lends itself to a few broad trading styles:
Range tactics around the 4,050-4,110 band.
With price oscillating between repeated support at 4,050 and resistance above 4,100, short-term traders often treat the band as a mean-reverting range until a clear breakout occurs.
Breakout-continuation setups.
Trend followers usually wait for a decisive daily close outside the current band. A move above 4,135–4,140 with strong volume would open the door to a retest of 4,200+ highs, while a break below 4,000 would bring the 3.955 area and prior breakout points into focus.
Pullback-to-moving-average approaches.
Because price sits close to the 50- and 100-day moving averages, some traders pay attention to how gold behaves when it tests these lines. Respecting them tends to confirm a trend pause; losing them convincingly can be an early warning of a deeper correction.
Any approach needs tight risk management, given that ATR suggests daily swings of around 20 dollars per ounce and short-term sentiment can shift quickly around key macro headlines.
EBC Financial Group offers XAUUSD as part of its multi-asset line-up, alongside major FX pairs, indices, commodities and stock CFDs. Traders can follow gold's support and resistance zones on advanced charting platforms, set alerts near key levels, and scale position sizes to match their own risk tolerance.
With EBC Financial Group, traders can:
Trade XAUUSD alongside major currencies, equity indices and other metals.
Place stop-loss and take-profit orders around the zones outlined above.
Access in-house research on gold, including intraday and longer-term outlooks.
Risk warning: Trading leveraged products such as CFDs involves a high level of risk and may not be suitable for all investors. You can lose more than your initial investment. Consider your objectives and seek independent advice if needed.
On higher timeframes, XAUUSD is still in an uptrend, with price holding far above its 52-week low and near the upper end of the range. On the daily chart, it is trading sideways between about 4,050 and 4,110, which looks more like a consolidation range than a clean trend.
Immediate support sits near 4.050. followed by the psychological 4,000 area and deeper support close to 3,955. Resistance is clustered around 4,090-4,110, then 4,135-4,140. with the major supply zone near the recent 4,200-4,244 highs.
Daily RSI on gold futures sits around 56. while MACD remains positive but not extreme. Stochastic and CCI are near mid-range. That profile suggests bullish bias and ongoing trend, but not classic overbought readings.
Many gold traders watch the daily chart for structure, the 4-hour chart for swing entries around levels like 4,050 and 4,110. and intraday charts such as 1-hour or 15-minute for fine-tuning trade management. The higher-timeframe trend still guides the overall bias.
Yes, XAUUSD is available to trade with EBC Financial Group as a CFD, subject to local regulations and account conditions. Traders can combine EBC's platforms, research and risk tools to build their own approach to gold. Always keep position sizing and downside risk in mind.
Gold's longer-term picture remains constructive, with XAUUSD still elevated after a strong multi-month rally and daily indicators leaning to the bullish side. At the same time, price action has shifted into a consolidation band between roughly 4,050 and 4,110. under the 4,200+ highs.
The next decisive move is likely to be signalled by how gold behaves at those key levels: holding above 4,050 and reclaiming resistance would keep the uptrend roadmap intact, while sustained trade below 4.000 would point to a deeper corrective phase toward prior breakout zones.
Traders weighing whether to engage now or wait typically anchor their decisions around that map, their risk tolerance, and the time horizon they care about most.
If you are considering trading XAUUSD or other major markets, make sure you understand the risks, work with a regulated provider such as EBC Financial Group, and use a clear plan for position sizing and risk control.
Disclaimer: This material is for general information purposes only and is not intended as (and should not be considered to be) financial, investment or other advice on which reliance should be placed. No opinion given in the material constitutes a recommendation by EBC or the author that any particular investment, security, transaction or investment strategy is suitable for any specific person.