Trading can seem overwhelming at first glance, especially when faced with a wall of charts, lines, and jargon. But some concepts are easier to grasp than they appear — and moving average crossovers are a great example. This widely-used method helps traders spot potential trend changes, making it a handy tool for beginners and experienced traders alike.
What Is a Moving Average Crossover?
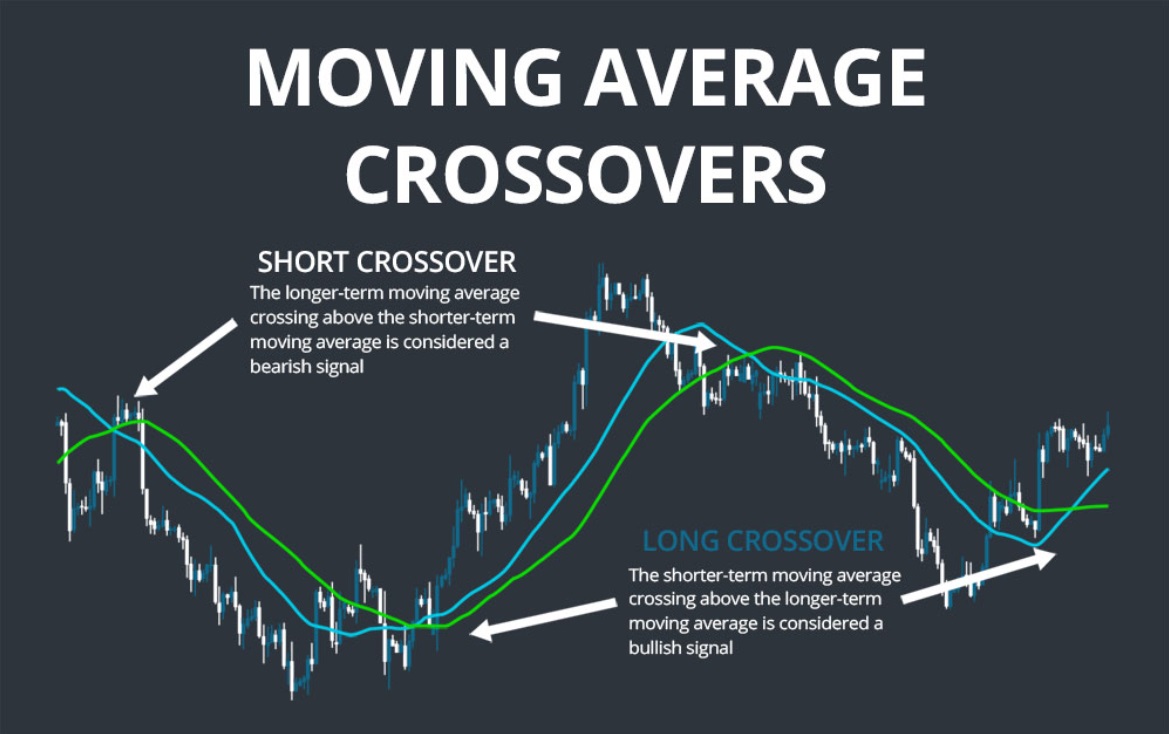
At its core, a moving average is a line on a chart that smooths out price data by showing the average value over a set period — like 10 days or 50 days. It helps filter out the "noise" of short-term price movements and gives a clearer picture of overall direction.
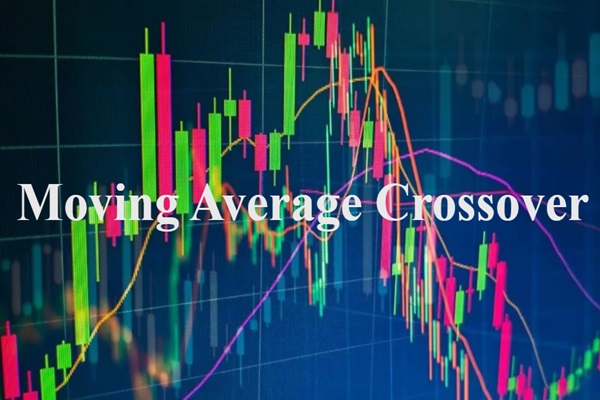
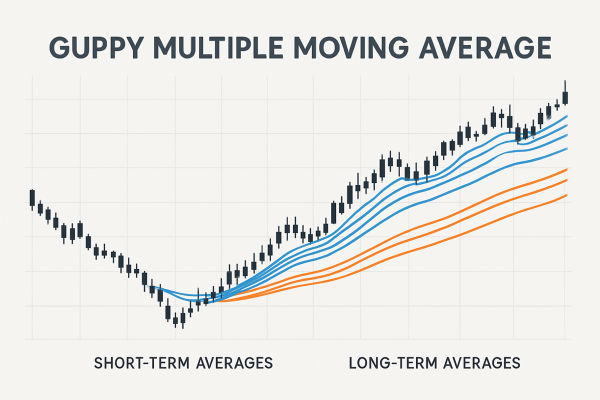
A crossover happens when two of these moving averages — typically a short-term and a long-term one — intersect. That moment where one line crosses the other can signal a change in momentum or trend. It's not about predicting the future; it's about recognising when something might be shifting.
Think of it like two cars on the same road. When the faster car (short-term average) overtakes the slower one (long-term average), that change in position can tell you something new is happening — and traders pay attention.
Types of Moving Averages: SMA vs. EMA
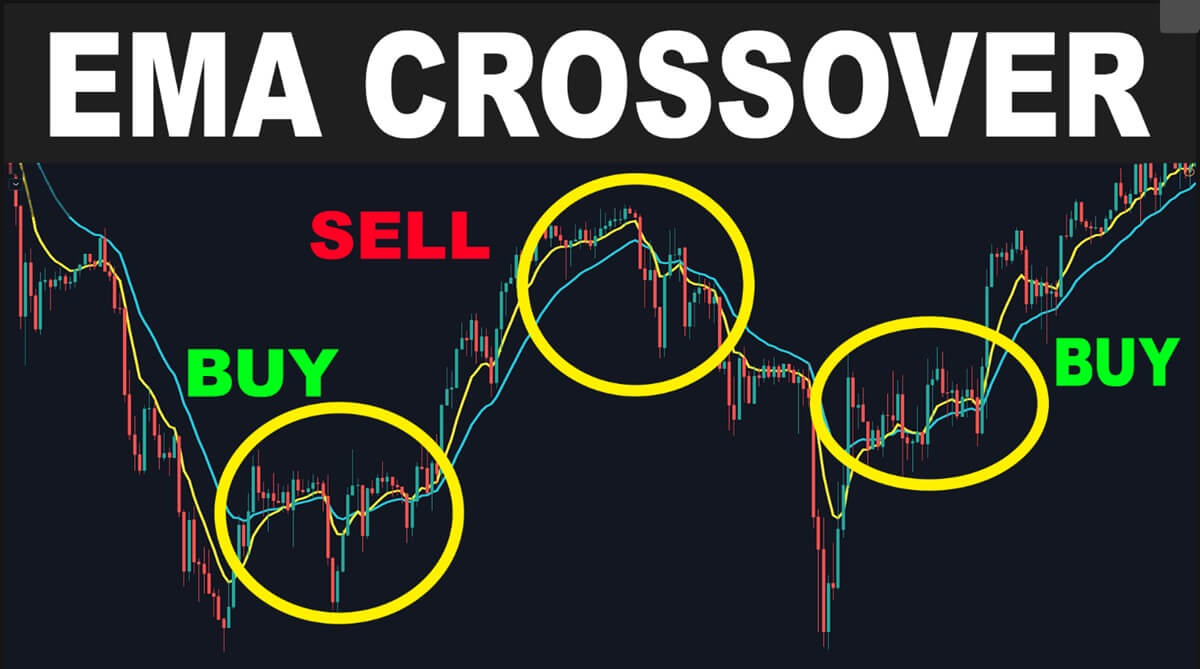
Before using a crossover strategy, it helps to understand the two main types of moving averages: Simple Moving Averages (SMA) and Exponential Moving Averages (EMA).
A Simple Moving Average gives equal weight to each day in the time period. For example, a 10-day SMA adds up the closing prices for the last 10 days and divides by 10. It's smooth and steady — ideal for identifying longer-term trends.
An Exponential Moving Average puts more weight on recent prices, making it more responsive to market changes. If the market is moving quickly, the EMA will react faster than the SMA, which some traders prefer for spotting early shifts.
When it comes to crossovers, either can be used, and it often comes down to your strategy and timeframe.
Golden Cross and Death Cross Explained
Some crossover points are so well-known that they have names — and rather dramatic ones at that.
The Golden Cross is when a short-term moving average (like the 50-day) crosses above a long-term average (like the 200-day). This is generally seen as a bullish signal, suggesting upward momentum and a possible long-term uptrend.
On the flip side, the Death Cross happens when the short-term average crosses below the long-term one. This is usually viewed as bearish, indicating downward pressure and potential weakness ahead.
Of course, these signals aren't crystal balls. They reflect what the price action is doing — not necessarily what it will do — but they're useful for context and decision-making.
How to Interpret Crossover Signals
When looking at crossover signals, timing and confirmation are key. A crossover alone isn't always enough to act on — especially in choppy markets where prices move sideways and produce false signals.
One way to interpret a signal is to combine it with overall trend direction. If a Golden Cross occurs during an already rising market, it might reinforce a bullish view. If a Death Cross appears in a flat or uncertain market, you might wait for other indicators to back it up.
Some traders also look for volume confirmation. If a crossover happens alongside a spike in trading volume, it may suggest stronger conviction behind the move.
Another helpful tip: shorter timeframes (like the 5-day and 10-day) can give more signals, but they're also more sensitive and prone to "whipsaws" — quick reversals that can lead to false alarms. Longer timeframes (like the 50-day and 200-day) are slower, but often more reliable.
Limitations of Moving Average Crossovers
As useful as crossover strategies can be, they're far from perfect. Like any tool, they work best when you understand their strengths and limitations.
First, they lag — by design. Since they're based on past prices, they don't tell you what's about to happen, only what has happened. That means you might miss the very start of a new trend because the crossover won't occur until it's already underway.
Second, they don't work well in sideways markets, where prices fluctuate within a tight range. In these conditions, you might get several crossover signals that lead nowhere — which can be frustrating and lead to losses if not managed carefully.
Lastly, relying solely on moving averages without considering other tools or market context can lead to poor decisions. Crossovers work best when they're part of a broader strategy that includes things like support/resistance levels, volume analysis, or even fundamental news.
Final Thoughts
The moving average crossover is one of the most straightforward and commonly used strategies in technical trading. It helps traders spot potential changes in momentum and can offer useful insights when used thoughtfully. Whether you're looking for long-term trend signals like the Golden Cross or experimenting with short-term strategies using EMAs, this tool can be a great addition to your trading approach.
Just remember, no indicator is foolproof. The real skill lies in knowing how to combine tools, interpret signals in context, and manage risk along the way.
If you're new to technical analysis, moving average crossovers are a great place to start — and from there, you can build towards more complex and refined trading strategies with confidence.
Disclaimer: This material is for general information purposes only and is not intended as (and should not be considered to be) financial, investment or other advice on which reliance should be placed. No opinion given in the material constitutes a recommendation by EBC or the author that any particular investment, security, transaction or investment strategy is suitable for any specific person.
