Published on: 2025-10-24
Updated on: 2025-10-26
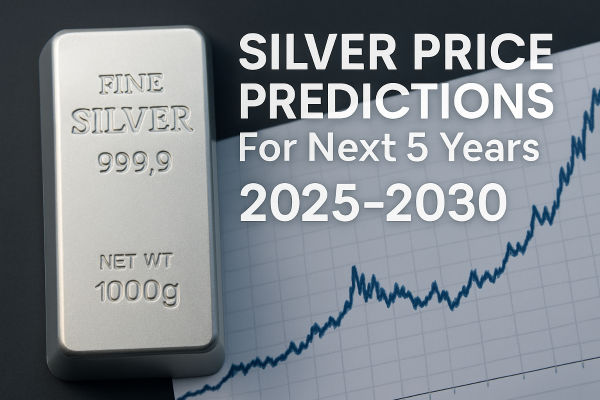
As of October 2025, silver has surged into the $45–$53/oz area and briefly touched all-time nominal highs, driven by a mix of ETF inflows, physical shortages in key delivery hubs, and stronger industrial demand.

The near-term outlook (next 6–12 months) is data and flows dependent: a base case of consolidation in the $40–$60 range is most likely, a bullish case (continued squeeze + weaker dollar) could lift silver toward $70+ by 2026–2027, while a bear case (ETF outflows, Chinese supply response, or a strong US dollar/real yields rebound) could produce a meaningful pullback toward $25–$35.
Investors should size their positions according to market volatility, monitor five key indicators (ETF flows, COMEX/LBMA inventories, US real yields, industrial demand, and China policy), and avoid chasing leverage in a market that can experience sudden squeezes.
| Indicator | Approx. Value / Trend | Notes |
|---|---|---|
| Spot Silver Price | ~$48.50/oz (Oct 24 2025) | After sharp 6% one-day drop from ~$54. |
| Global Supply Deficit | ~115–118m oz projected in 2025 | Still material shortfall. |
| ETF Holdings | ~1.13 billion oz (mid-2025) | ETF inflows strong. |
| Silver ETF New Inflows (US) | ~US$2 billion YTD 2025 | Silver ETF rush noted. |
| Volatility: one-day move | −6% decline after ~$54 peak | Largest drop since recent run. |
US COMEX warehouses recorded massive on-exchange stocks earlier in October (records near 530 million troy ounces), while London inventories were unusually tight, creating cross-market premium/dislocation dynamics. [1]
The movement of metal between hubs and the prospect of import tariffs or trade frictions have influenced where the physical metal sits and how expensive immediate physical delivery can be.
The Silver Institute's World Silver Survey 2025 and other analysts flagged a growing annual supply deficit (mine growth is modest because silver is often a byproduct of other mining), and rising industrial demand, particularly from PV and electronics.
Analysts estimated a substantial 2025 supply shortfall vs prior years.
Physical silver ETF flows surged as investors sought exposure to the metal's asymmetric upside relative to gold. ETF inflows can be extremely price-sensitive in silver's smaller market and have a magnified effect on price discovery. [2]

Rate Cuts: Major central banks, including the Fed, are forecast to begin easing cycles in late 2025. Low or falling real yields make silver more attractive as a non-yielding asset and an inflation hedge.
Dollar Impact: US dollar swings continue to affect silver in lockstep with gold. A declining dollar since Q3 2025 has contributed to some of the rally in XAG/USD.
Emerging Interest: While gold remains the primary official reserve asset, 2025 marked the first year Russia's central bank announced major silver purchases (~$535 million in the next three years), with others exploring the same. This is a new structural support for silver.
ETF Flows: Investment demand through silver ETFs reached record highs, reflecting a desire to diversify beyond gold.
Solar and Electronics: Industrial use, dominated by photovoltaic (PV) solar panels, electric vehicles (EVs), and advanced electronics, consumes more than 50% of global silver demand as of 2025.
Projections: By 2030, forecasts suggest solar could absorb 15–20% of annual silver production, with electronic and battery applications also scaling rapidly.
Supply Growth: Mine output rose by about 2% in 2025, driven by expansions in Mexico and Poland. However, this was somewhat balanced by a slight decrease in demand and consistent recycling.
Deficit Outlook: The global supply deficit is projected to narrow in 2025 to about 115–118 million ounces, marking the fifth consecutive year of deficits, but the gap remains material.
Forecasts: Methodologies from Metals Focus, the World Silver Survey, and other analyst groups expect persistent deficits to continue through the decade unless technological disruptions change demand or new mining capacity comes online.
Firstly, silver's market capitalisation and annual tradable supply are much smaller than gold's. This indicates that each dollar spent has a greater impact on silver than on gold.
Silver serves dual purposes: it is both an industrial commodity and a store of value. When investors view it as a hedge during times of geopolitical or macroeconomic stress, and at the same time, industrial demand for silver increases, these two factors create a compounding effect on demand.
Finally, physical market plumbing, where metal is stored and deliverable, creates localised imbalances that turn into global price dislocations. These structural facts explain the volatility and why simple comparisons with gold can mislead: silver amplifies both bullish and bearish forces.
| Year | Average Price Forecast | Year-End Target | Notes |
|---|---|---|---|
| 2025 | $38–$45/oz | $41–$51/oz | Volatility expected, high close likely |
| 2026 | $45–$48/oz | $47–$51/oz | Industrial demand shines |
| 2027 | $47–$55/oz | $55–$63/oz | Green tech ramps, new highs possible |
| 2028 | $54–$64/oz | $65–$78/oz | Deficits persist, supply tightens |
| 2029 | $62–$70/oz | $70–$86/oz | Peak demand window |
| 2030 | $71–$90/oz | $92–$99/oz | Several forecasts see $100/oz touched |
Key Forecasts
CoinPriceForecast: Sees silver ending 2025 near $41.66, climbing to $47–$51 by the end of 2026, and projects a move to $99 by 2030.
HSBC: Raised its 2026 price forecast to $44.50/oz (October 2025), reflecting worries about future supply shortages.
LongForecast: Bullish, with highs in the $60–$80/oz range by 2028–2030 if deficits persist.
Investing News Network: Argue that $100/oz is possible by 2030 on cumulative green demand shocks and new central bank and investment flows.
In short, most major commodities analysts maintain a bullish to cautiously optimistic stance for silver from 2025 to 2030. The market narrative focuses on:
Steady or rising deficits from green demand spikes;
Central banks are beginning to add silver reserves.
Weakening dollar and Fed easing cycle favouring non-yielding assets;
Investment flows through exchange-traded funds (ETFs) remain strong.
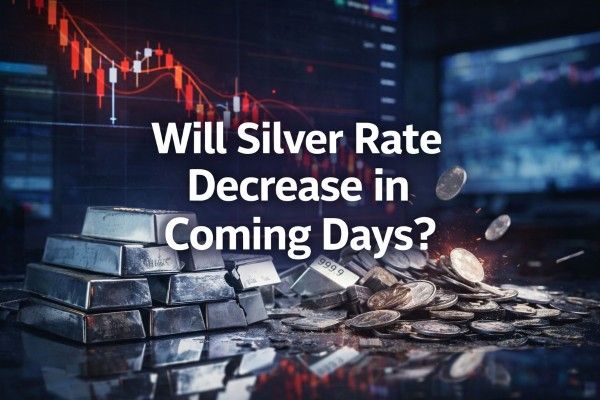
Pullbacks and sharp corrections are inevitable in a market as volatile as silver. However, structural support from both industry and investment makes a deep and prolonged bear market unlikely unless risks materialise strongly.

Path: Silver averages $45–$60 in 2026, drifts to $40–$65 through 2027–2028, and by 2030, a higher long-run equilibrium (real terms) near $45–$70/oz depending on global industrial growth.
Why: ETF flows moderate but remain positive, industrial demand grows steadily (solar, electronics), mine production increases slowly because silver is often a byproduct, and supply deficits persist intermittently.
Central banks stay supportive of risk assets at times, and the USD real yields trend remains benign.
Path: Silver climbs above $70–$100 into 2026–2027, with upside extensions toward $120/oz in a peak scenario by 2028 if investment flows accelerate and physical tightness deepens.
Why: A combination of continued record ETF inflows, sustained industrial demand growth (accelerated EV/renewables rollouts), China export hiccups and a materially weaker US dollar/real yields fall could create an extended delivery squeeze.
Policy-backed purchases or strategic stockpiling by industrial groups or sovereign funds would accelerate the move. Bank of America and some strategists flagged multi-month targets in the high range under aggressive flow scenarios.
Path: Silver corrects to $25–$40 range by 2026 and may trade sideways to lower into 2028 before recovering toward the end of the decade.
Why: Heavy speculative positioning triggers a flush, ETFs see outflows, China loosens export constraints or ramps up production, the US dollar and real yields rise materially (raising the opportunity cost of holding non-yielding metal), or industrial demand softens during a global slowdown. Any combination could rapidly reverse momentum.
The single most direct barometer of investor demand. If inflows turn negative, the bull case weakens fast.
Watch where the metal sits. Large outflows from exchange warehouses into the physical market or shipments from US hubs to London signal physical tightness.
Real interest rates influence silver; decreasing real yields and a weaker dollar bolster precious metals.
Solar PV installations, electronics capex, and EV/motor demand trends. If these accelerate, structural deficits deepen. The Silver Institute's monthly updates and Metals Focus reports are good sources.
China's refining and export decisions remain decisive. Loosening export policies or increasing Chinese refining capacity could reduce shortages; on the other hand, export restrictions could exacerbate supply issues.
If the global economy slows more than expected, for example, if the US or China sees a hard landing, industrial silver demand would likely soften, leading to corrective price action.
If the Federal Reserve pivots back to hiking or the dollar rebounds sharply, investment flows to silver could shrink, resulting in substantial pullbacks as opportunity costs rise.
If silver mining technology advances or new major deposits are brought online, and/or recycling volume grows more than expected, the supply gap could close faster than consensus models project.
New industrial or technological solutions that can replace silver in solar, automotive, or electronics applications, such as copper or graphene, could slow long-term price growth if they are commercialised at scale before 2030.
There is no clear winner as gold is a purer monetary safe haven with far deeper markets; silver adds industrial exposure, making it more volatile. Use silver as a tactical or portfolio diversification play rather than a pure inflation hedge.
Silver can outperform during periods when both investment and industrial demand accelerate simultaneously. In 2025, silver outperformed gold; however, past performance is not an indicator of future results. [3]
Most optimistic forecasts suggest that silver could reach triple digits if demand from solar and electric vehicles remains high, supply stays constrained, and central bank or investment influxes increase.
Dollar-cost averaging and tactical purchases during corrections benefit long-term investors, while sharp spikes may provide opportunities for active traders to take profits.
In late 2025, silver is experiencing one of its strongest bull runs in decades, driven by exceptional industrial demand, central bank accumulation, and a changing global macro backdrop.
Forecasters see a base case of steady appreciation, with potential for $70–$100/oz by 2030 if green energy, electrification, and new reserve demand persist. Pullback risks exist, but are likely to be short-term, offset by the metal's critical role in the coming energy and tech revolutions.
Disclaimer: This material is for general information purposes only and is not intended as (and should not be considered to be) financial, investment or other advice on which reliance should be placed. No opinion given in the material constitutes a recommendation by EBC or the author that any particular investment, security, transaction or investment strategy is suitable for any specific person.
[1] https://www.reuters.com/world/china/tons-silver-us-china-ease-london-spot-market-squeeze-2025-10-20/
[2] https://www.etf.com/sections/features/silver-etfs-rally-toward-records-can-50-be-broken
[3] https://www.barrons.com/articles/silver-price-all-time-high-8bba33ff