Published on: 2025-10-13
Updated on: 2025-10-13
Imagine watching a marathon, the moment the starting gun fires, runners sprint out, setting the pace for the entire race. The same thing happens in the stock and forex markets every morning. The first hour of trading is like that starting gun: fast, emotional, and often decisive.
Professional traders know this secret well. The early market moves often determine the tone for the entire day, and the Opening Range Breakout (ORB) strategy is built precisely to capture that first burst of momentum.
If you've ever wondered how traders seem to know when to jump in as soon as the market opens, this guide will explain the logic, steps, and psychology behind the ORB strategy in simple terms any beginner can understand.
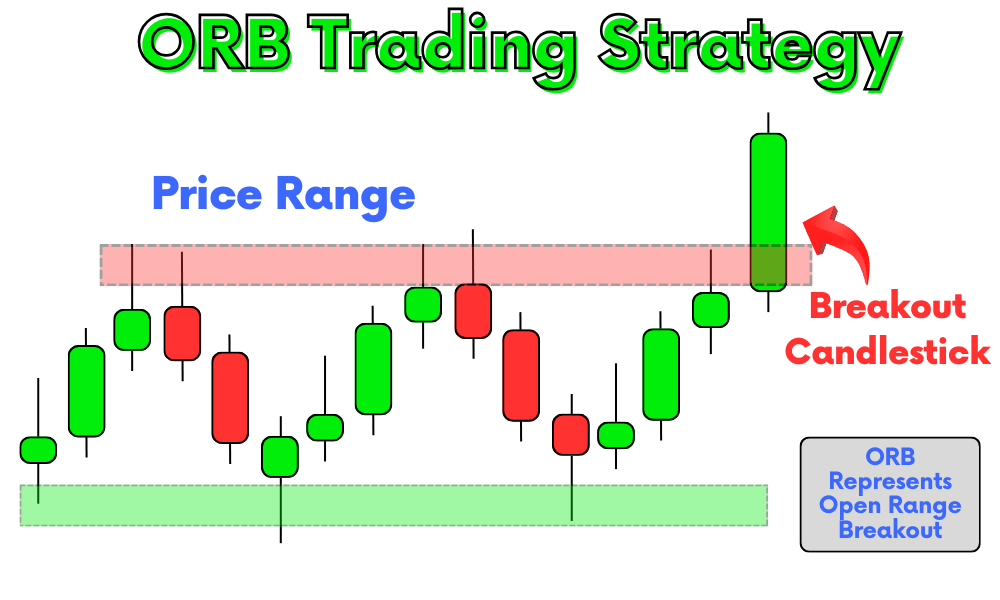
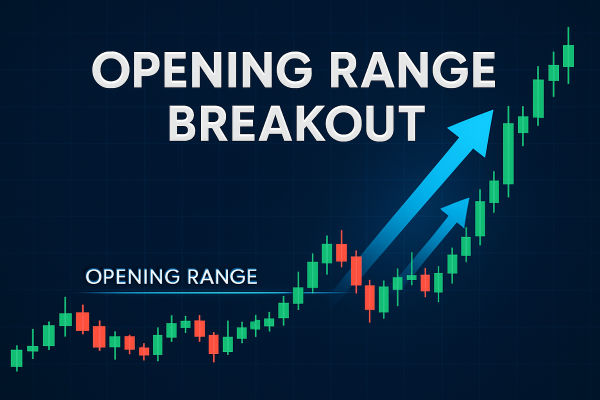
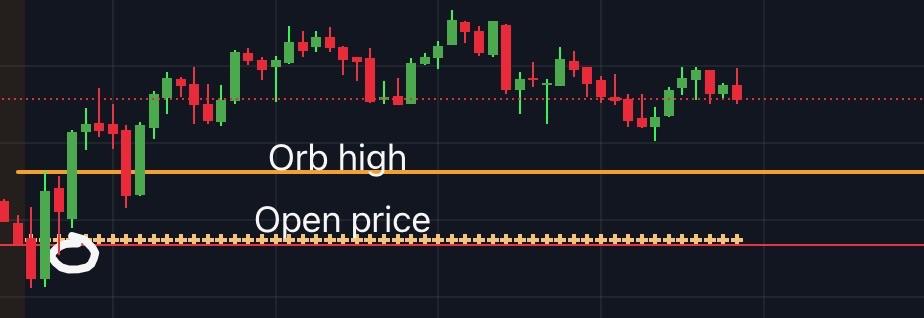
As highlighted above, the Opening Range Breakout (ORB) strategy is a trading approach that focuses on the price movement during the first few minutes after a market opens, usually the first 15 to 60 minutes.
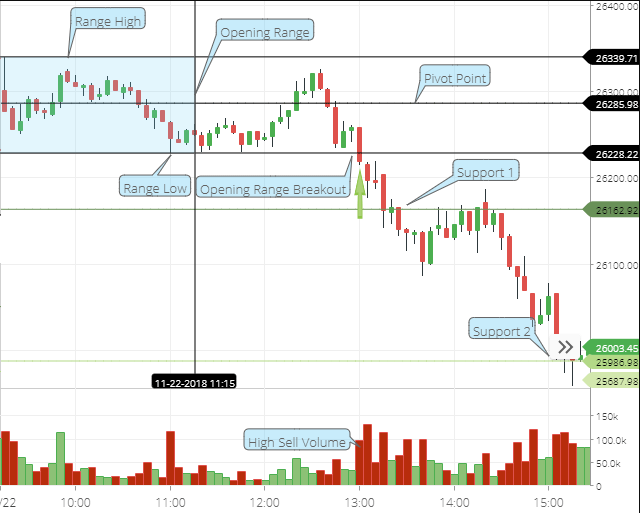
During this time, traders mark the high and low prices of the asset within that period. These levels form the "opening range."
The idea is simple:
Once the price breaks above the high or below the low of that opening range, it often signals the direction of momentum for the rest of the day.
In essence:
Break above range high → Potential uptrend (buy signal)
Break below range low → Potential downtrend (sell signal)
The opening minutes of the market session are when liquidity, volume, and volatility surge. Institutions, funds, and retail traders all react to overnight news, earnings reports, or global developments.
This flood of activity helps define the day's initial battle between buyers and sellers. The range formed during this battle is crucial because:
It reflects market sentiment at the start of the day.
It often acts as short-term support or resistance.
A breakout from this range can indicate institutional participation and strong directional intent.
Think of it like a tug-of-war. The first team to break the line (the range) often controls the momentum, at least for the next few rounds.
Here's how traders typically apply the ORB strategy:
Choose a specific time window after the market opens. Common options include:
15-minute ORB
30-minute ORB
1-hour ORB
For example, in the U.S. stock market (which opens at 9:30 a.m. ET), a 30-minute ORB uses data from 9:30 to 10:00 a.m. The high and low during this period become your key breakout levels.
Once the range is established, watch for the price to shift above or below it
.
If the price breaks above the high, you consider buying (going long).
If it breaks below the low, you consider selling (going short).
The breakout should ideally happen with increased volume, confirming that real traders (not just algorithms) are backing the move.
Risk management is crucial.
Place a stop-loss slightly inside the opposite side of the range.
Establish a profit goal that is typically 1.5 to 2 times your stop distance.
For example, if your range is 40 points wide and you enter on a breakout, you might risk 20 points to make 40.
Some traders exit once their target is hit, while others trail their stop to follow strong trends. The advantage of ORB is its adaptability, as it serves scalpers, day traders, and swing traders equally well.
Let's use a example based on the NASDAQ 100 Index (NDX).
The market opens at 9:30 a.m. ET.
Between 9:30 and 10:00 a.m., the high is 18,720 and the low is 18,640.
The range = 80 points.
At 10:10 a.m., the price breaks above 18,720 with heavy volume.
A trader enters a long position at 18,725, setting:
Stop-loss: 18,680 (below the range midpoint)
Target: 18,805 (80-point move = 1:2 risk/reward)
Within 45 minutes, the index hits the target as momentum continues upward, a classic ORB success.
However, if the price had reversed and fallen back below the range, a disciplined trader would have exited early with a small, controlled loss.
The ORB is one of the most popular intraday setups worldwide for a few powerful reasons:
It's simple: You only need two key levels; high and low.
It's time-efficient: You can trade only the first 1–2 hours of the day.
It's data-driven: Relies on actual market action, not predictions.
It's versatile: Works across equities, forex, indices, and commodities.
It captures early momentum: You're trading alongside institutional volume.
In short, it's a perfect blend of discipline and opportunity.
| Advantages | Limitations |
|---|---|
| Clear and simple entry/exit rules | False breakouts can lead to quick losses |
| Works across multiple asset classes | Requires discipline and timing |
| High risk-to-reward potential | Doesn’t perform well in choppy, low-volume sessions |
| Easy to automate | Early volatility can trigger whipsaws |
| Time-efficient for part-time traders | Emotional pressure in fast-moving markets |
Many traders combine ORB with indicators to filter false signals and strengthen entries. Some common combinations include:
High volume confirms genuine breakout strength.
If the breakout aligns with the direction of a 20 EMA or 50 EMA, it's more likely to sustain.
Steer clear of purchasing breakouts with RSI over 70 or selling when it's under 30; this could indicate exhaustion.
A breakout occurring above VWAP indicates bullish sentiment; if it happens below, it's bearish. VWAP serves as a trend indicator in intraday trading.
ORB stands for Opening Range Breakout, a strategy that focuses on price movement during the first minutes after the market opens.
Most traders use the first 15, 30, or 60 minutes of market activity to mark the high and low points.
Beginners often start with a 30-minute ORB, balancing early momentum with reduced volatility.
No. It performs best on days with clear news, volatility, or earnings events.
Yes, it's one of the simplest intraday setups for new traders, provided they practice proper risk management.
In conclusion, the Opening Range Breakout strategy is proof that sometimes the simplest ideas are the most effective. By focusing on the first burst of daily momentum, you align yourself with institutional traders and the broader market flow.
But remember: the ORB is not about predicting direction, it's about reacting with discipline when direction reveals itself.
Disclaimer: This material is for general information purposes only and is not intended as (and should not be considered to be) financial, investment or other advice on which reliance should be placed. No opinion given in the material constitutes a recommendation by EBC or the author that any particular investment, security, transaction or investment strategy is suitable for any specific person.