The Arnaud Legoux Moving Average (ALMA) is a sophisticated technical analysis tool designed to provide traders with a more responsive and smoother moving average compared to traditional indicators like the Simple Moving Average (SMA) and Exponential Moving Average (EMA).
Developed by Arnaud Legoux and Dimitrios Kouzis-Loukas in 2009. ALMA aims to reduce lag and filter out market noise, offering clearer trend signals.
In this article, we'll break down how ALMA works, highlight its key advantages over traditional moving averages, and explore practical trading strategies for applying it effectively.
Introduction to the Arnaud Legoux Moving Average (ALMA)
1) Overview of ALMA
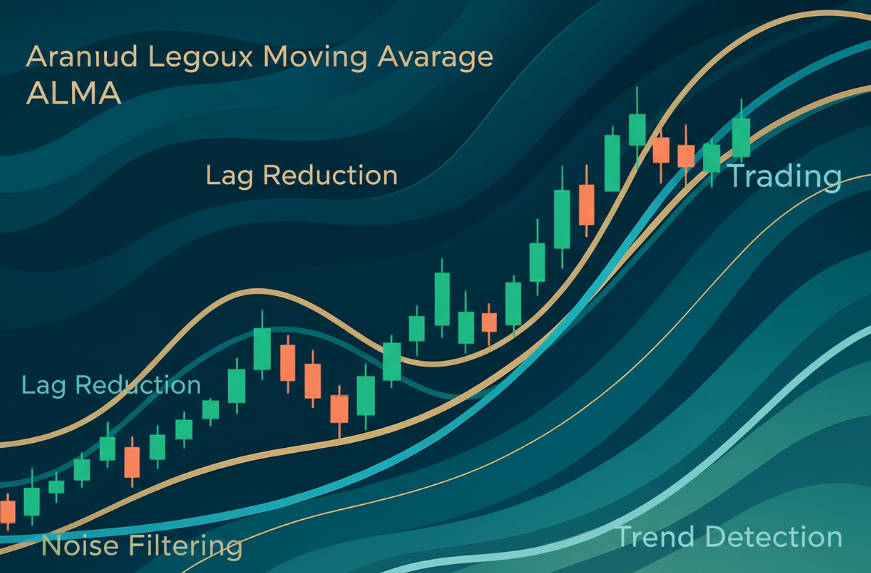
The ALMA is a type of weighted moving average that employs a Gaussian distribution to assign weights to price data points.
This method allows for more emphasis on recent prices while reducing the influence of older data, resulting in a moving average that is both responsive and smooth.
2) Key Advantages Over Traditional Moving Averages
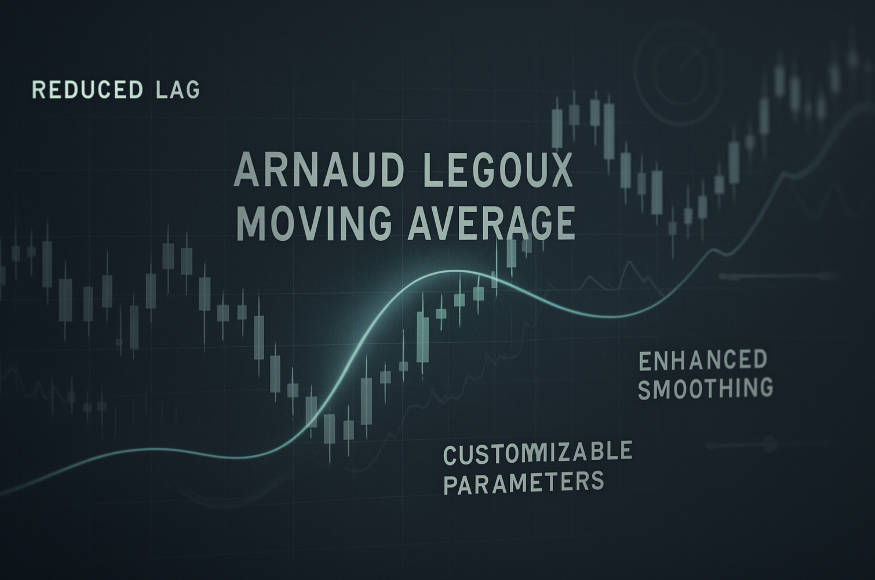
Reduced Lag: ALMA adjusts more swiftly to price changes, providing timely signals.
Enhanced Smoothing: The Gaussian filter minimizes market noise, offering clearer trend insights.
Customizable Parameters: Traders can fine-tune ALMA's settings to align with specific market conditions and trading strategies.
Mathematical Foundation and Calculation of ALMA
1) Core Formula
The ALMA is calculated using the following formula:

Where:
Price[i−n]: The price at time i−n.
Weight[n]: The weight assigned to the price at time i−n, determined by a Gaussian distribution.
2) Key Parameters
Window Size (n): Determines the number of periods over which the average is calculated.
Offset (o): Shifts the Gaussian distribution to prioritize more recent data points.
Sigma (σ): Controls the width of the Gaussian curve, affecting the smoothness of the moving average.
3) Interpretation of Parameters
Window Size: Affects the responsiveness of ALMA; shorter windows react faster to price changes.
Offset: A higher offset value makes ALMA more responsive but less smooth; a lower value increases smoothness but introduces more lag.
Sigma: A larger sigma value broadens the Gaussian curve, leading to a smoother average; a smaller sigma makes ALMA more sensitive to price changes.
Practical Applications of ALMA in Trading
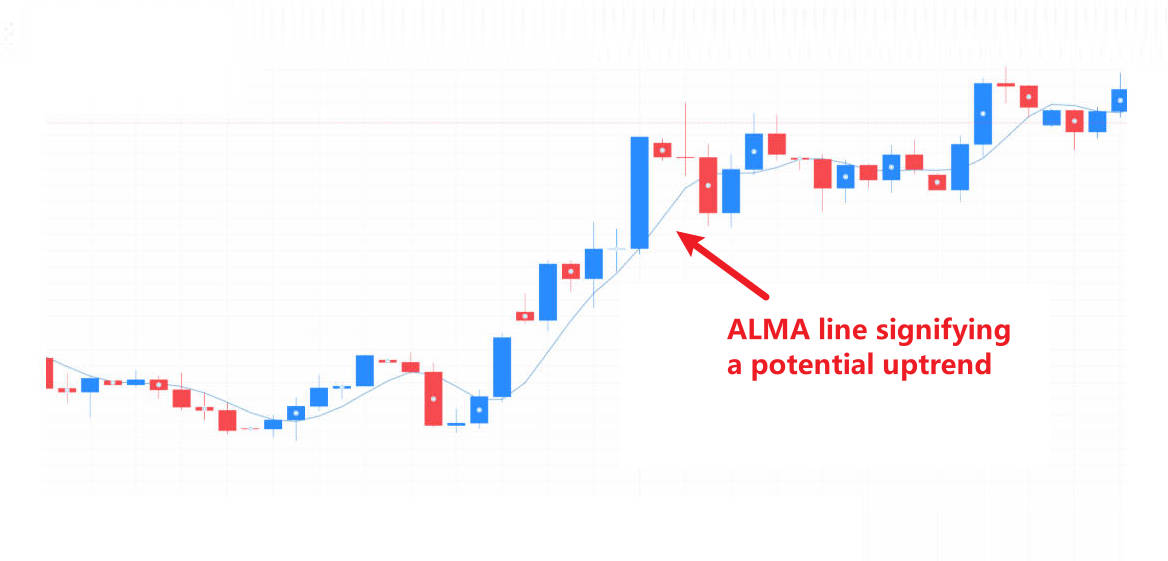
1) Trend Identification
Bullish Trend: When the price is consistently above ALMA, it indicates a strong upward trend.
Bearish Trend: When the price is consistently below ALMA, it suggests a strong downward trend.
2) Support and Resistance Levels
Dynamic Support: In an uptrend, ALMA can act as a dynamic support level.
Dynamic Resistance: In a downtrend, ALMA can serve as a dynamic resistance level.
3) Signal Confirmation with Other Indicators
Combining ALMA with other indicators can enhance signal reliability:
ALMA-Based Trading Strategies
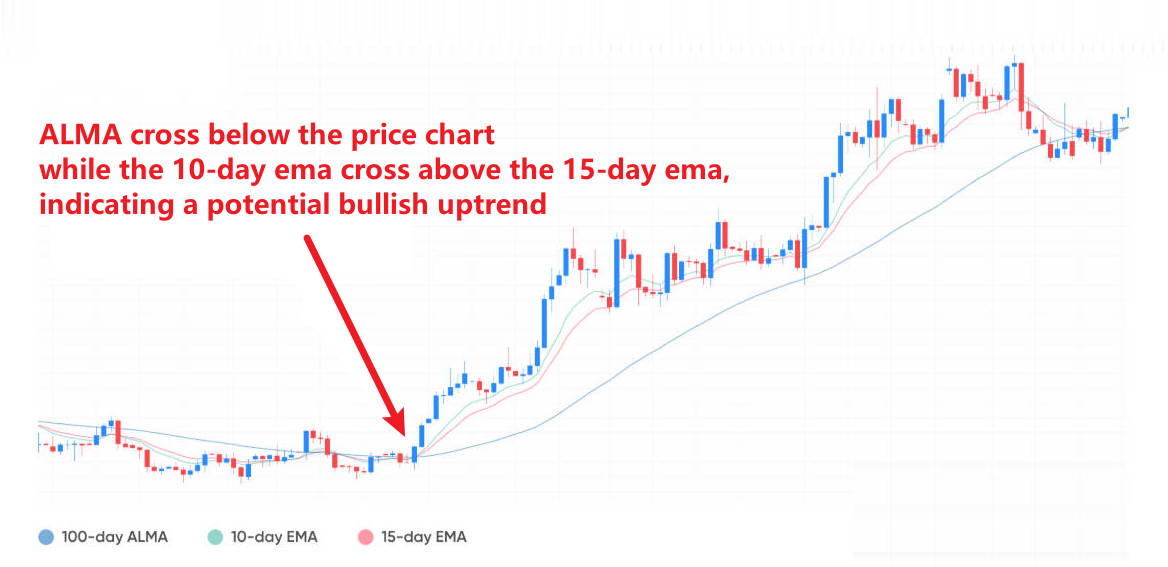
1) Trend Following Strategy
Setup: Use ALMA to determine the primary trend direction.
Entry Signal: Enter long positions when the price is above ALMA and the trend is upward; enter short positions when the price is below ALMA and the trend is downward.
Exit Signal: Exit positions when the price crosses ALMA in the opposite direction.
2) Crossover Strategy
Setup: Combine ALMA with a shorter-term moving average (e.g., 5-period EMA).
Entry Signal: Enter long positions when the short-term EMA crosses above ALMA; enter short positions when it crosses below.
Exit Signal: Exit positions when the crossover occurs in the opposite direction.
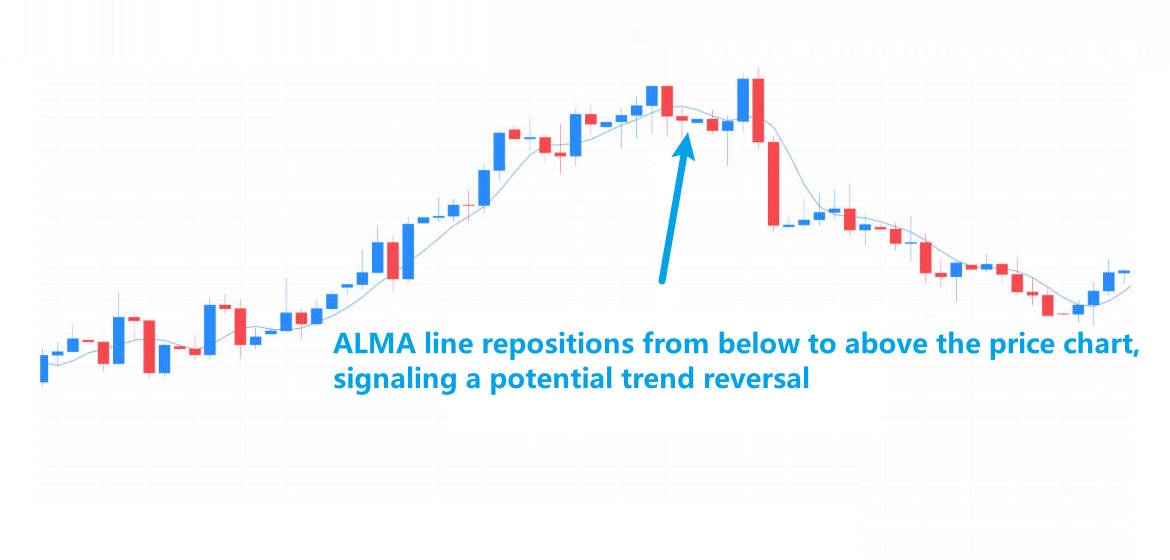
3) Breakout Strategy
Setup: Identify consolidation zones where the price is moving sideways near ALMA.
Entry Signal: Enter long positions when the price breaks above ALMA with increased volume; enter short positions when it breaks below with increased volume.
Exit Signal: Exit positions when the price returns to the consolidation zone or shows signs of reversal.
Integration of ALMA with Other Technical Indicators
Combining ALMA with other indicators can provide more robust trading signals:
| Indicator |
Purpose |
How to Combine with ALMA |
| RSI |
Identifies overbought/oversold |
Use ALMA to determine trend direction and RSI to confirm entry points |
| Bollinger Bands |
Measures volatility |
Use ALMA as a dynamic middle band and observe price interactions with outer bands |
| MACD |
Identifies momentum |
Use ALMA to filter trades and MACD for momentum confirmation |
Advantages and Limitations of ALMA
1) Advantages
Reduced Lag: ALMA's design minimizes the delay in responding to price changes.
Noise Filtering: The Gaussian distribution effectively filters out market noise, providing clearer signals.
Flexibility: Customizable parameters allow traders to adapt ALMA to various market conditions.
2) Limitations
Complexity: The mathematical foundation may be challenging for beginners to grasp.
Overfitting Risk: Excessive customization of parameters can lead to overfitting, reducing the effectiveness of the indicator.
Availability: Not all trading platforms offer ALMA as a default indicator, requiring manual installation in some cases.
Frequently Asked Questions (FAQs)
Q1: What is the optimal setting for ALMA?
The optimal settings depend on your trading style and the asset being traded. For short-term trading, a window size of 9 and offset of 0.85 are commonly used. For longer-term trends, a window size of 50 or 100 may be more appropriate.
Q2: Can ALMA be used for cryptocurrency trading?
Yes, ALMA is effective in cryptocurrency markets due to its ability to filter noise and provide clear trend signals, which is crucial in the highly volatile crypto space.
Q3: How does ALMA compare to EMA?
While both ALMA and EMA give more weight to recent prices, ALMA uses a Gaussian distribution and an offset, allowing for smoother and more responsive signals with less noise compared to EMA.
Q4: Is ALMA suitable for automated trading?
Yes, ALMA can be implemented in automated trading systems. Platforms like TradingView and MetaTrader support ALMA, and it can be coded into algorithmic trading strategies.
Q5: Can ALMA be used in conjunction with other indicators?
Absolutely. ALMA can be combined with indicators like RSI, MACD, or Bollinger Bands to enhance trading strategies and improve signal accuracy.
Conclusion
The Arnaud Legoux Moving Average (ALMA) offers traders a sophisticated tool for trend analysis and signal generation. Its unique design provides a balance between responsiveness and smoothness, making it a valuable addition to any trading strategy.
By understanding its calculation, applications, and integration with other indicators, traders can leverage ALMA to enhance their trading decisions and improve overall performance.
Disclaimer: This material is for general information purposes only and is not intended as (and should not be considered to be) financial, investment or other advice on which reliance should be placed. No opinion given in the material constitutes a recommendation by EBC or the author that any particular investment, security, transaction or investment strategy is suitable for any specific person.
