Published on: 2025-12-12
Updated on: 2025-12-12
Risk reward ratio is the cornerstone of effective risk management for traders and investors. It allows you to assess whether a trade's potential return justifies the amount of risk that you take before committing capital.
Understanding and applying this ratio properly can improve your long‑term profitability and reduce emotional decision making.
In this article we will explain what risk reward ratio is, why it matters, how to calculate it, how professional traders use it in real scenarios, and how you can build and use a practical spreadsheet for analysis.

The risk reward ratio is a numerical measure that compares the potential loss of a trade or investment to the expected profit. It is expressed as a ratio in the form X:Y, where X represents the potential risk and Y represents the potential reward. Traders and investors use this ratio to determine whether an opportunity is attractive before entering a position.
For example, if a trader risks £100 to potentially make £300, the risk reward ratio is 1:3. A ratio of 1:2 or better is often considered favourable among many professional traders.
The ratio focuses on outlining:
The amount you could lose if the trade goes against you.
The amount you aim to gain if the price reaches your target.
This comparison helps traders to prioritise trades that offer higher potential reward relative to risk.
Risk reward ratio is more than a formula; it is a practical decision‑making framework. Traders use it for several reasons:
Consistent Profit Planning:
It enables you to determine whether the potential profit justifies the risk before trading.
Discipline and Objectivity:
It reinforces disciplined entry and exit rules, preventing emotional trading.
Improved Performance Metrics:
When combined with win rate and expectancy analysis, it supports long‑term performance.
Professional traders often aim for a minimum ratio of 1:2 or 1:3, meaning the potential reward is twice or three times the risk. This means even if they lose more trades than they win, positive expectancy can still be achieved.
Calculating the risk reward ratio requires three key trade parameters:
Entry Price: The price at which you enter the trade.
Stop‑Loss Price: The level where you will exit if the trade moves against you to limit loss.
Take‑Profit Price: The level where you will exit to secure profit if the trade moves in your favour.
| Trade Component | Value |
|---|---|
| Entry Price | £100 |
| Stop‑Loss | £95 |
| Take‑Profit | £115 |
| Risk (Loss) | £5 |
| Reward (Profit) | £15 |
| Risk Reward Ratio | 1:3 |
In this example:
The risk is calculated as Entry Price minus Stop‑Loss (£100 − £95 = £5).
The reward is calculated as Take‑Profit minus Entry Price (£115 − £100 = £15).
The ratio of Reward to Risk is 15/5 = 3, or 1:3.

Below are commonly used risk reward setups across different trading styles. These represent realistic targets based on market behaviour and typical trader preferences.
| Trading Style | Typical Risk Reward Ratio |
|---|---|
| Scalping | 1:1 to 1:2 |
| Day Trading | 1:2 to 1:3 |
| Swing Trading | 1:3 to 1:5 |
| Position Trading | 1:5 and above |
This summary shows how the expected holding period and market behaviour influence risk reward targets.
To understand risk reward ratio in action, here are real trade style examples that illustrate how professional traders implement it:
Suppose a trader studies technical chart patterns and identifies a breakout in a major stock:
| Trade Detail | Value |
|---|---|
| Entry Price | USD $202 |
| Stop‑Loss | USD $199 |
| Target Price | USD $211 |
| Risk | $3 |
| Reward | $9 |
| Ratio | 1:3 |
In this scenario, the trader sets a stop‑loss just below a key support level and takes profit at a resistance zone. The 1:3 ratio means the trader aims to earn three times the amount risked. Peer research shows that such ratios are widely recommended for swing and breakout trades.
In foreign exchange (Forex) markets, pips are used to measure price movement. Consider this setup:
| Trade Component | Value |
|---|---|
| Currency Pair | EUR/USD |
| Entry Price | 1.0850 |
| Stop‑Loss | 1.0800 |
| Take‑Profit | 1.0950 |
| Risk | 50 pips |
| Reward | 100 pips |
| Ratio | 1:2 |
This risk reward ratio of 1:2 is typical for pullback trades where traders exit at logical support or resistance. Higher ratios are often preferred when market volatility supports extended moves.
Professional traders do not use the ratio in isolation. They combine it with other elements of effective trading:
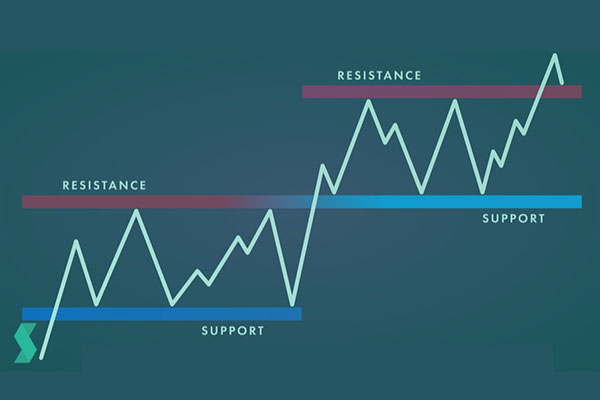
Traders use support and resistance levels, candlestick patterns, Fibonacci retracements and other indicators to choose entry and exit levels that support favourable risk reward setups.
Risk reward ratio relates directly to a strategy's expectancy. Even with a lower win rate, a strong risk reward ratio can deliver profits over time.
Traders rarely adjust stop‑loss or take‑profit levels once a trade is live unless market conditions change significantly. This discipline protects the integrity of risk reward planning.
Traders often make errors that weaken the effectiveness of the ratio:
Ignoring Market Structure:
Setting arbitrary targets without using key levels.
Overoptimising for Unattainable Targets:
Chasing extremely high ratios, such as 1:10, without considering realistic price movement.
Neglecting Probability and Volatility:
Not accounting for whether the market conditions make the target achievable.

A well‑structured spreadsheet helps you track, calculate and analyse risk reward performance across trades.
| Column | Description |
|---|---|
| Trade Date | Date of the trade |
| Asset | The security or pair traded |
| Entry Price | The price at which the trade was entered |
| Stop‑Loss | Level to limit loss |
| Take‑Profit | Target level for profit |
| Risk | Calculated risk per trade |
| Reward | Calculated reward per trade |
| Risk Reward Ratio | Reward ÷ Risk |
| Outcome | Win or loss result |
| Trade Date | Asset | Entry | Stop | Target | Risk | Reward | Ratio | Result |
|---|---|---|---|---|---|---|---|---|
| 2025‑10‑01 | AAPL | 202 | 199 | 211 | 3 | 9 | 3 | Win |
| 2025‑10‑05 | EUR/USD | 1.0850 | 1.0800 | 1.0950 | 50 | 100 | 2 | Loss |
The spreadsheet will automatically calculate risk and reward values using formulas such as:
Risk = Entry − Stop‑Loss
Reward = Target − Entry
Risk Reward Ratio = Reward ÷ Risk
This structure allows you to see patterns in your performance and identify which setups consistently produce favourable outcomes.
Backtesting involves testing your risk reward rules against historical prices:
Calculate average ratio performance over many trades.
Compare win rates against risk reward ratios.
Visualise results using performance charts to assess drawdowns and cumulative gains.
A good risk reward ratio is typically at least 1:2, meaning the potential profit is twice the possible loss. This allows traders to be profitable even with a moderate win rate.
Subtract the stop‑loss price from the entry price to find risk, and subtract the entry price from the take‑profit price to find reward. Divide reward by risk to get the ratio.
Yes, by planning trades based on clear risk reward parameters, traders can avoid impulsive decisions and filter out unfavourable opportunities, supporting consistent outcomes.
Not always. Extremely high ratios may be unrealistic in certain markets and reduce the number of trade opportunities. Balance with probability and market context.
The risk reward ratio is a critical metric for disciplined trading and investment decision making. When combined with structured analysis, technical planning, and trade journaling, it becomes a powerful tool that helps you judge opportunities objectively and manage losses proactively. Used consistently, risk reward analysis supports strong long‑term performance and helps professional traders sustain profitability.
Disclaimer: This material is for general information purposes only and is not intended as (and should not be considered to be) financial, investment or other advice on which reliance should be placed. No opinion given in the material constitutes a recommendation by EBC or the author that any particular investment, security, transaction or investment strategy is suitable for any specific person.