Published on: 2026-09-09
Updated on: 2026-09-09

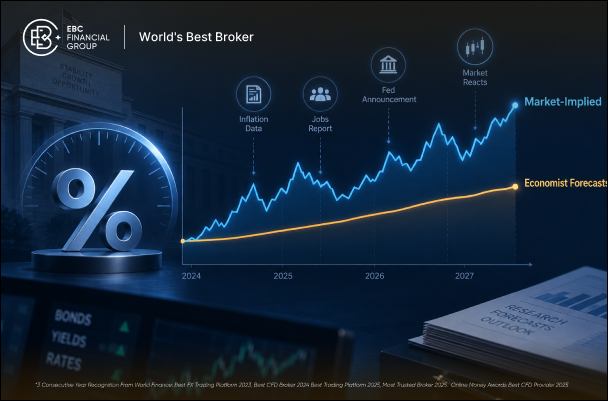
Market-implied rate paths and economist forecasts can point to different outcomes even when both assess the same central bank and economy. One may suggest several rate cuts over the coming year while the other expects policy to stay tighter for longer.
The gap is not always a forecasting contest. Economist consensus figures usually summarise central or most-likely scenarios, while market-implied rates come from traded instruments that can reflect expectations, risk premiums and positioning.
Market-implied rate paths are prices from which policy expectations are inferred, not pure surveys of what participants believe will happen.
Near-term futures pricing can sometimes be translated into meeting probabilities, while longer-dated curves are increasingly affected by risk or term premiums.
Economist consensus figures are often averages or medians of point forecasts, although some surveys also collect probability distributions.
A gap between market pricing and forecasts can reflect different economic views, risk compensation, timing, hedging demand or market technicals.
A market-implied rate path is derived from instruments such as overnight index swaps, fed funds futures and other short-term interest-rate contracts. Their prices can be used to infer where policy rates are being priced across future meetings.
This is a traded, risk-neutral price rather than a survey average. Expectations are embedded in it, along with the value investors place on different risks.
At very short horizons, where only a few policy outcomes are plausible and premiums are small, market pricing may approximate probability-weighted expectations reasonably well. Farther out, risk or term premiums can create a meaningful wedge between the traded forward rate and the policy path participants actually consider most likely.
The Federal Reserve’s July 2026 Monetary Policy Report illustrates the issue. Its displayed OIS-implied federal funds path was estimated while explicitly assuming a term premium of zero. That qualification shows why a forward curve cannot automatically be read as the market’s ordinary average forecast.
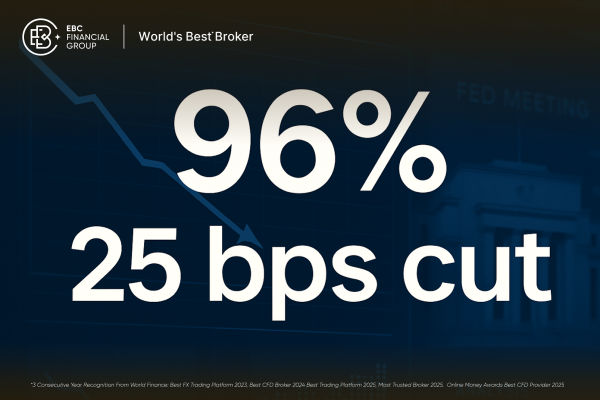
If the realistic outcomes at the next meeting are no change or a 25-basis-point cut, futures pricing can sometimes be converted into approximate probabilities under specific assumptions. That is the logic behind statements such as “markets imply a 70% chance of a 25bp cut.”
Saying “the OIS curve implies a 3.5% policy rate in twelve months” is different. That figure spans multiple meetings and possible paths. As the horizon extends, expectations interact more heavily with risk premiums and other pricing effects, so longer-dated paths require more caution.
Economist forecasts usually begin with a macroeconomic scenario. Forecasters form views on inflation, growth, employment, wages and financial conditions, then estimate how the central bank is likely to respond.
Headline consensus figures are often averages or medians of point forecasts. A forecast for three cuts, for example, usually represents a central or most-likely outcome under the forecaster’s assumptions.
Some professional surveys also ask respondents to assign probabilities to different policy outcomes. New York Fed research has shown that a survey respondent’s modal forecast can differ from the probability-weighted mean implied by the full distribution. Once those probabilities are incorporated, the survey mean can move closer to market pricing.
The relevant comparison is therefore not simply “markets versus economists,” but which market measure and which type of forecast are being compared.
| Measure | What it broadly represents |
|---|---|
| Economist point forecast | Forecaster’s central or modal scenario |
| Economist survey consensus | Mean or median across multiple forecasts |
| Market-implied rate | Traded risk-neutral pricing that can include premiums |
| Options-implied distribution | Risk-adjusted pricing across possible rate outcomes |
| Central-bank projection | Policymakers’ conditional policy or economic assessments |
Suppose an economist forecasts 75 basis points of cuts over the next year, while the actual real-world probabilities are:
25% chance of 100bp of cuts
40% chance of 75bp
25% chance of 50bp
10% chance of no cuts
The probability-weighted expectation is 67.5bp of easing:
25% × 100bp = 25bp
40% × 75bp = 30bp
25% × 50bp = 12.5bp
10% × 0bp = 0bp
If those were the true probabilities and there were no relevant premiums or technical distortions, 67.5bp would be the expected amount of easing.
A traded futures or OIS rate can still differ because investors do not necessarily value every possible state in proportion to its real-world probability. They may demand compensation for adverse rate outcomes or pay for protection against them. Market pricing therefore contains information about expectations and about how risk itself is priced.
New York Fed research has long emphasised that changes in market-implied policy paths can reflect changes in monetary-policy expectations, compensation for interest-rate risk, or both.
Hedging and positioning can add to the difference. Institutions may trade for liability, balance-sheet or risk-management reasons rather than because their macroeconomic forecast has changed. The curve should therefore not be read as a clean poll of future policy.
A 2026 Bank of England episode shows the distinction clearly.
After the Iran war began in February, the short end of the UK OIS forward curve moved materially higher and became upward sloping. Read naively, it appeared to suggest that Bank Rate was expected to rise.
The Bank’s Market Participants Survey told a different story. Respondents’ most-likely Bank Rate path was broadly flat over the following year. Bank staff then used a term-structure model to separate expected rates from the premium embedded in the curve and concluded that much of the upward slope reflected unusually large short-end risk premiums rather than a central expectation of rate increases.
In the June 2026 survey, participants attributed an average 32.3% of the gap to asymmetric risks, 24.1% to risk premia, 22.4% to changes in most-likely Bank Rate expectations and 18.3% to market technical and positioning effects.
MPC member Alan Taylor made the broader point in June: an elevated OIS curve can be useful for measuring financial conditions while still being an imperfect guide to the underlying expected path of Bank Rate.
The case shows how a market curve and survey forecast can point in different directions without one necessarily being wrong. They can be measuring different objects.
Risk premiums are only part of the explanation. Markets and economists can also reach genuinely different conclusions about inflation, growth and the central bank’s reaction function.
Markets may price faster cuts after weak employment data or a financial shock. Economists may retain a slower easing path if they expect inflation to remain persistent. The reverse can happen when economists anticipate disinflation that markets are not yet willing to price.
Timing can temporarily widen the gap. Interest-rate markets react continuously to data and speeches, while surveys and published forecasts are updated periodically. A survey released after a major inflation report may still contain responses submitted before the data arrived.
Faster repricing does not guarantee greater accuracy. It simply reflects a different update timetable.
Start by identifying what each number is designed to show.
For the next central-bank meeting, short-dated futures can help gauge how a limited set of outcomes is priced. For the next year or two, an OIS curve shows forward rates embedded in traded markets, but risk premiums deserve more attention.
Economist consensus forecasts show the central macroeconomic view across forecasters. Probability-based surveys reveal risks around those central cases. Options show how different outcomes are priced, although those distributions are also risk-adjusted. Central-bank projections provide conditional assessments rather than promises about future rates.
When the measures diverge, three questions help: Have expectations genuinely changed? Has the price of risk changed? Or are the measures simply being observed at different times or summarising different concepts?
Market-implied rate paths and economist forecasts can diverge because they are constructed differently and often answer different questions.
Economist forecasts usually describe a central scenario. Market-implied rates come from traded, risk-neutral prices that incorporate expectations but can also contain meaningful risk premiums, hedging demand and technical effects. Near-term meeting probabilities can offer a relatively clean read on discrete outcomes, while longer-dated curves require more caution.
The gap itself can therefore be informative. It may reveal genuine disagreement about the economy, a change in the price of rate risk, or simply a difference between a modal forecast and a market price.