In technical analysis, Chart Patterns provide vital insights into market behaviour and potential price movements. Among the most recognisable and widely used formations is the M pattern, also known as the double top pattern. This formation plays a key role in identifying bearish reversals and is often relied upon by traders across various financial markets, including forex, stocks, and cryptocurrencies. Understanding how to read and respond to the M pattern can give traders a significant edge in timing their trades and managing risk effectively.
What Is the M Pattern in Trading?
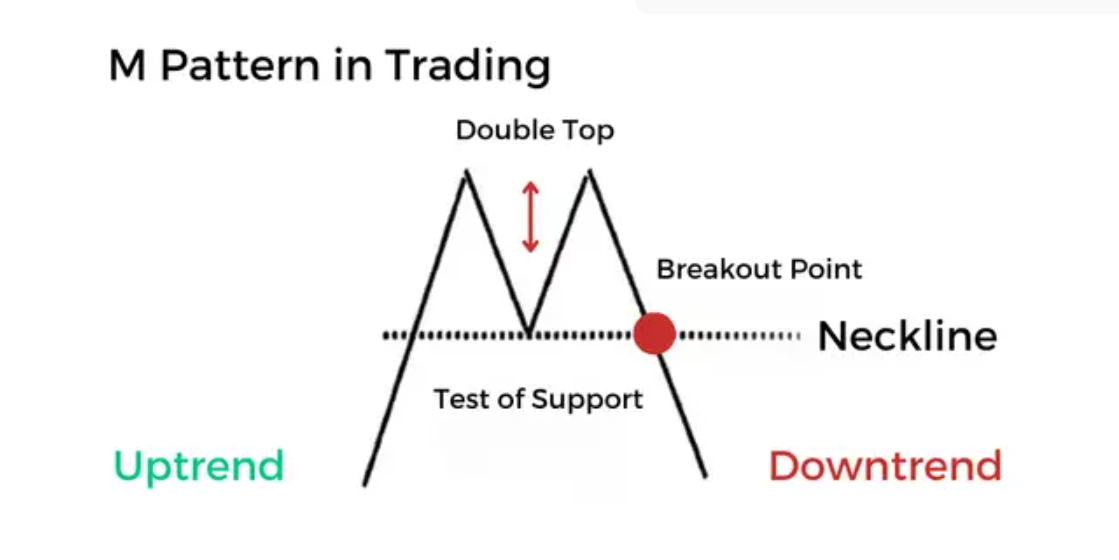 The M pattern is a classic bearish reversal pattern that signals the end of an uptrend and the potential beginning of a downtrend. As the name suggests, the pattern resembles the letter "M" when plotted on a price chart. It typically forms after a strong upward price movement and consists of two peaks at similar price levels, with a moderate trough in between.
Here is how it generally unfolds:
First peak: Price reaches a new high, but then retreats.
Trough: A minor pullback occurs, establishing a short-term support level.
Second peak: Price rallies again but fails to surpass or match the previous high, showing signs of weakness.
Breakdown: Price declines below the support line (formed by the trough), confirming the bearish reversal.
This breakdown often triggers selling pressure, as it signals that buyers are losing control and bears are taking over.
How Does the M Pattern Work in Technical Analysis?
The M pattern is rooted in market psychology. The first peak represents a high point in bullish sentiment, while the pullback indicates a brief consolidation. When price attempts to retest the high and fails to break above it during the second peak, it reflects diminishing bullish momentum and increasing selling interest.
Technical analysts interpret this sequence as a sign of a trend reversal. The failure to create a higher high is particularly important, as it suggests that buying pressure is fading. Once the price breaks below the "neckline" (the support level at the bottom of the trough), it often triggers a wave of selling as traders exit long positions and others enter short trades.
The M pattern is frequently confirmed by:
Decreasing volume during the second peak.
Bearish divergence in momentum indicators (e.g. RSI or MACD).
Break of key support levels on higher timeframes.
The formation is often more reliable when it appears after a prolonged uptrend and is supported by other technical signals.
When to Trade the M Pattern: Entry and Exit Points
Timing is crucial when trading the M pattern. Traders should avoid entering positions too early and wait for pattern confirmation before executing trades.
Entry Point:
The most common entry point is when the price closes below the neckline, which confirms the pattern's validity. This is known as a breakout entry. Conservative traders may wait for a retest of the neckline after the breakout before entering to reduce the risk of a false breakdown.
Stop-Loss Placement:
A logical stop-loss can be placed just above the second peak, giving some room for market noise. This helps manage risk if the pattern fails and the price resumes its upward trend.
Take-Profit Target:
The profit target is often set by measuring the height of the pattern (the distance between the peaks and the neckline) and projecting it downwards from the breakout point. For example, if the distance from the peak to the neckline is 100 pips in forex, the expected move downward could also be around 100 pips.
Some traders use multiple targets, scaling out of their position as the price moves in their favour to lock in profits progressively.
M Pattern vs W Pattern: What's the Difference?
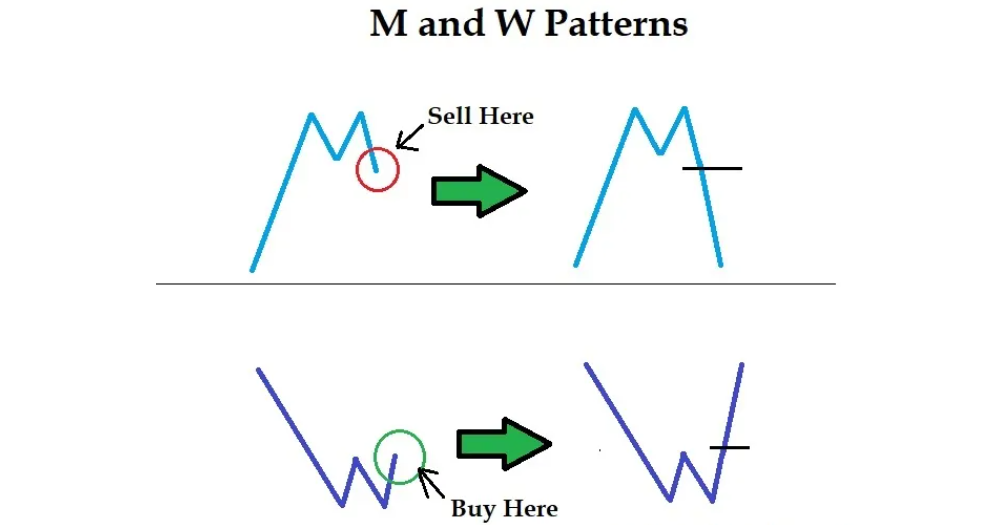
The M and W patterns are often discussed together, as they are mirror opposites and signal different market conditions.
M Pattern vs W Pattern
| Feature |
M Pattern |
W Pattern |
| Shape |
Resembles the letter "M" |
Resembles the letter "W" |
| Trend Direction |
Bearish reversal (after uptrend) |
Bullish reversal (after downtrend) |
| Peaks and Troughs |
Two peaks with a trough in between |
Two troughs with a peak in between |
| Entry Signal |
Break below neckline |
Break above neckline |
While the M pattern signals that sellers are gaining control, the W pattern suggests buyers are stepping in to reverse a downtrend. Both patterns work best when confirmed by volume and other indicators, and are more reliable on higher timeframes (e.g., 4H, daily, weekly).
Understanding the distinction between the two helps traders determine market sentiment and make better-informed decisions.
Conclusion
The M pattern is a powerful and widely recognised chart formation that can help traders anticipate bearish reversals and manage trades with greater precision. By learning how to spot this pattern, confirm it with volume and indicators, and enter with well-defined risk management, traders can turn a simple visual cue into a highly effective trading strategy.
However, like all tools in technical analysis, the M pattern is not foolproof. It should be used in conjunction with other forms of analysis and never relied on in isolation. With practice, backtesting, and proper discipline, the M pattern can become a reliable part of your trading toolkit—helping you avoid false breakouts and seize high-probability trade setups in any market.
Disclaimer: This material is for general information purposes only and is not intended as (and should not be considered to be) financial, investment or other advice on which reliance should be placed. No opinion given in the material constitutes a recommendation by EBC or the author that any particular investment, security, transaction or investment strategy is suitable for any specific person.


 The M pattern is a classic bearish reversal pattern that signals the end of an uptrend and the potential beginning of a downtrend. As the name suggests, the pattern resembles the letter "M" when plotted on a price chart. It typically forms after a strong upward price movement and consists of two peaks at similar price levels, with a moderate trough in between.


