Published on: 2026-06-10
Updated on: 2026-06-10
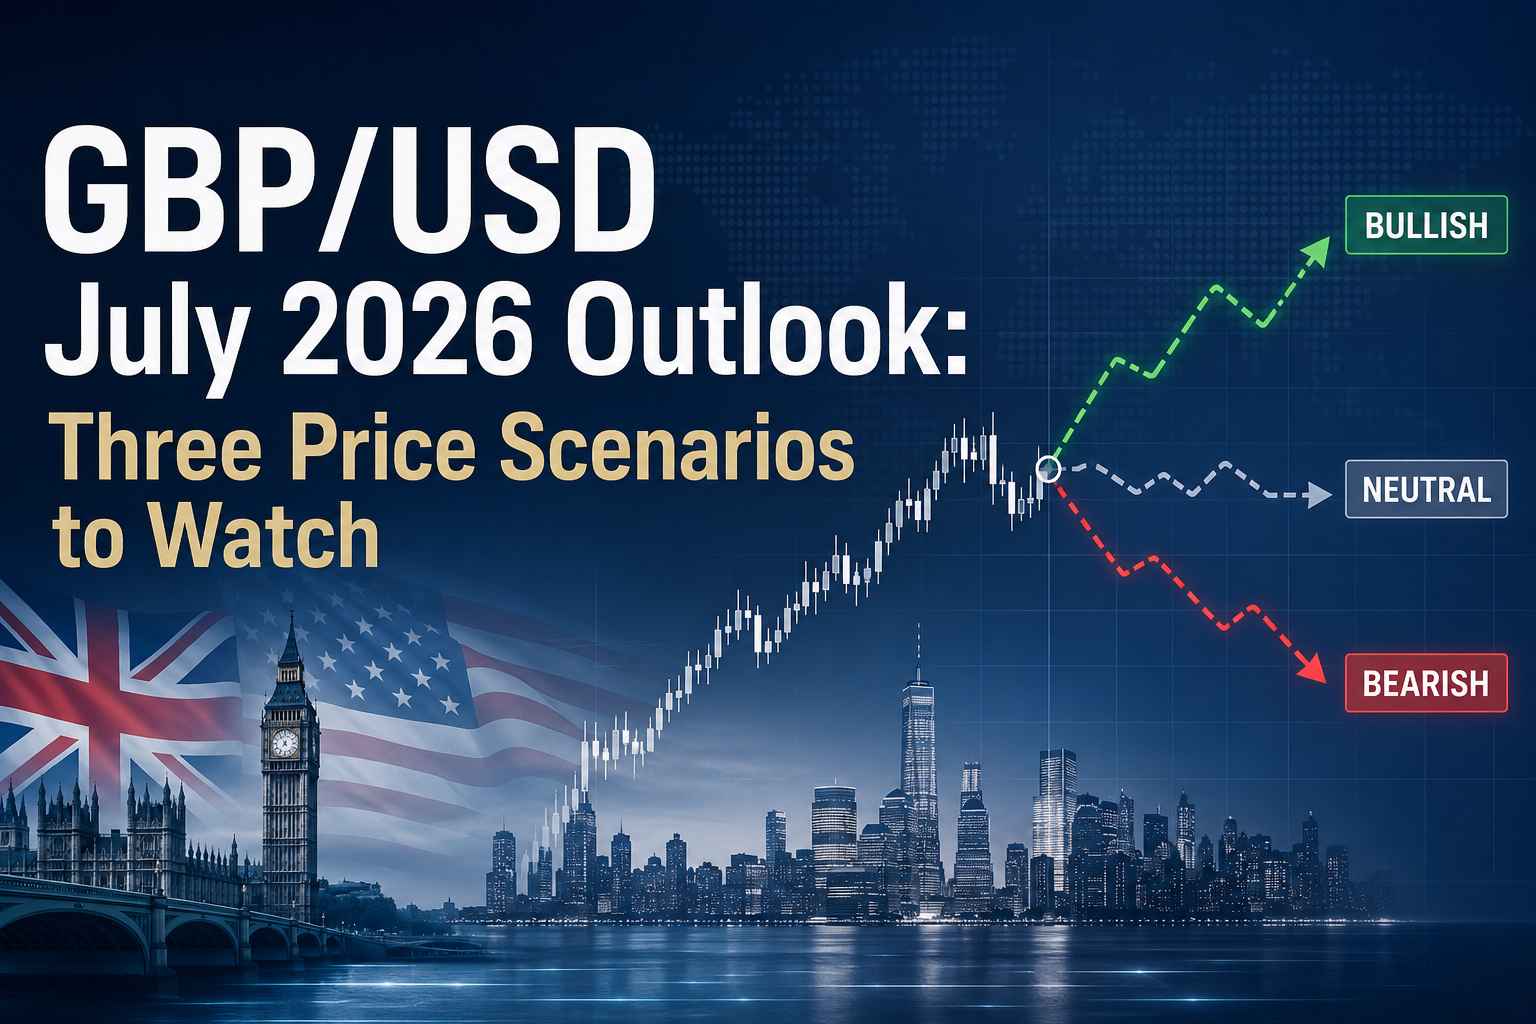
GBP/USD is testing the 1.3400 pivot on June 10, 2026, after basing at 1.3342 on June 5 and recovering as the US Dollar eased from recent highs.

The near-term bias is neutral with an upward lean while price holds above the June low. However, the burden of proof remains with buyers. Cable is still forming lower highs on the daily chart, which means the latest rebound has not yet confirmed a trend shift.
The framework below reviews market structure, momentum, key levels and two scenarios with clear invalidation points. Spot levels and trading ranges are market data; the structural view is technical interpretation.
Cable is testing 1.3400 after defending the 1.3342 June low. A daily close above the figure matters more than an intraday spike.
A sustained move above 1.3400 opens 1.3463, followed by the 1.3498 to 1.3500 confluence and 1.3568.
The bullish setup fails on a daily close below 1.3342.
Rejection at the pivot re-exposes 1.3342, then 1.3300, with 1.3009 marking the broader range floor.
Momentum has improved, but price remains below the 200-period average near 1.3498.
The US Dollar remains the main driver, shaped by Fed rate expectations and geopolitical risk.
On the weekly and daily charts, GBP/USD remains in a corrective phase within a larger uptrend. The pullback from the 1.3869 swing high is so far corrective in character, not impulsive, and the multiyear advance off the 2022 low stays intact while the pair defends the 1.3009 area.
The 52-week range of roughly 1.3009 to 1.3869 contains the entire move, and price is mid-range.
The daily structure is the constraint. The pair has carved a sequence of lower highs beneath descending trendline resistance, with bounces sold into. That pattern stays bearish-to-neutral until buyers produce a higher high, which is why acceptance above 1.3400 and the resistance shelf above it carries weight beyond the round number itself.
Momentum cooled into the June 5 to 9 lows. The pair traded below its short-term moving averages and relative-strength readings slipped toward the lower half of their range, consistent with a corrective leg rather than a reversal. The June 10 recovery has begun to repair that, but it is repair, not confirmation.
The distinction is the 200-period moving average near 1.3498, which has capped intraday rallies. Reclaiming 1.3400 is step one; sustained trade above 1.3500 is what would shift the short-term momentum read from corrective to constructive.
Absent a bullish momentum divergence at the lows, strength into resistance is best treated as provisional until a close confirms it.
| Type | Level / Reading | Note |
|---|---|---|
| Resistance | 1.3463 | Recent daily high |
| Resistance | 1.3498 to 1.3500 | 200-period MA and round-number confluence |
| Resistance | 1.3568 | Repeated reaction high |
| Resistance | 1.3657 | Higher swing resistance |
| Pivot | 1.3400 | Round-number line in focus |
| Support | 1.3342 | June 5 swing low, bull invalidation |
| Support | 1.3300 | Round-number support |
| Support | 1.3009 | 52-week low, range floor |
| EMA 20 | Near-term reclaimed | Short-term momentum improving |
| EMA 50 | Near-term reclaimed | Supports the recovery bias |
| EMA 200 | 1.3498 to 1.3500 | Main dynamic resistance |
| RSI | Lower half to neutral range | Momentum improving but not confirmed |
| MACD | Mild recovery signal | Needs stronger follow-through above 1.3400 |
These are decision levels, not signals in themselves. They mark where price has reacted before, which is where the next reaction becomes most informative.
For traders monitoring whether the 1.3400 pivot turns into breakout confirmation, EBC Financial Group provides market access and execution tools suited to fast-moving forex conditions.
The constructive path requires a daily close above 1.3400 that holds on a retest, turning the figure into support. That would expose the 1.3463 daily high, then the 1.3498 to 1.3500 band.
A close through that band is the more meaningful event. It would open 1.3568 and, structurally, raise the probability of a retest toward the 1.3869 range high.
Confirmation ideally pairs the breakout with dollar softening, whether from easing Fed rate-hike expectations or improved risk appetite. A break unsupported by a weaker dollar is the kind that tends to fail back into the range. Invalidation for this view is a daily close back below the 1.3342 swing low.
The alternative is a stall at or just above 1.3400 followed by a daily close below 1.3342. That would re-expose 1.3300 and put the 1.3009 range floor back in view over time.
Continued dollar strength on firm US data, or renewed risk aversion, would favour this path, which remains the structurally preferred risk while the daily trend of lower highs holds. A close above 1.3500 negates it.
The dollar is doing most of the work. Markets have leaned toward the possibility of a Fed rate increase later this year on firm US data, which caps GBP/USD, while shifting geopolitical risk has driven the dollar day to day.
On the sterling side, UK political uncertainty and a softening labour market continue to weigh on sentiment ahead of the Bank of England’s next decision. The relative rate path is the fundamental anchor beneath the 1.3400 test.
It is testing the figure now, but the valid signal is a daily close that holds on a retest, not an intraday spike, especially with the 200-period average still overhead.
A hold above the 1.3498 to 1.3500 band, ideally with a softer dollar behind it. That is the line between a bounce and a structural shift.
A daily close below the 1.3342 June low ends the bullish case; a close above 1.3500 ends the bearish one.
GBP/USD remains range-bound and dollar-led, and 1.3400 is the hinge. The daily structure still favours sellers, so the bounce earns the benefit of the doubt only on a confirmed close through resistance, not on the test itself.
With the dollar setting the direction, its reaction to Fed expectations and geopolitical risk is the variable most likely to settle the pivot in the sessions ahead.