Published on: 2026-06-15
EUR/NZD is trading around 1.9850 to 1.9871, little changed on the week after a slide of about 0.2%. The euro has spent recent sessions pinned inside a descending channel against the New Zealand dollar, pressing the upper boundary rather than breaking free of it.
Over the past 12 months the pair has ranged roughly between 1.88 to 1.90 on the downside and 2.06 to 2.07 on the upside, depending on the pricing source. The current price sits near the middle of that band, well below the November peak but above the recent 2026 trough.
EUR/NZD trades around 1.9850 to 1.9871, testing the upper edge of a descending channel rather than reversing it.
The bias stays soft while 1.9924 caps the upside, though moving-average signals differ by data provider rather than reading uniformly bearish.
Momentum is split: RSI near 39.8 leans bearish, while a Stochastic RSI around 15.5 is oversold and hints at a short-term bounce.
The pivotal range runs from 1.9800 support to 1.9924 resistance. A break below opens 1.9700 and 1.9400; a close above puts the channel top back in play.
Year-end forecasts diverge, from the mid-1.95s to above 2.00, so the medium-term direction is far from settled.

| Date | EUR/NZD |
|---|---|
| 15 June 2026 | Around 1.9850 to 1.9871 |
| 12 June 2026 | 1.9848 |
| 11 June 2026 | 1.9839 |
| 10 June 2026 | 1.9918 |
| 9 June 2026 | 1.9853 |
Price has compressed into a narrow range, holding broadly inside 1.984 to 1.992 over recent sessions. That tight consolidation keeps the burden of proof on the bulls.
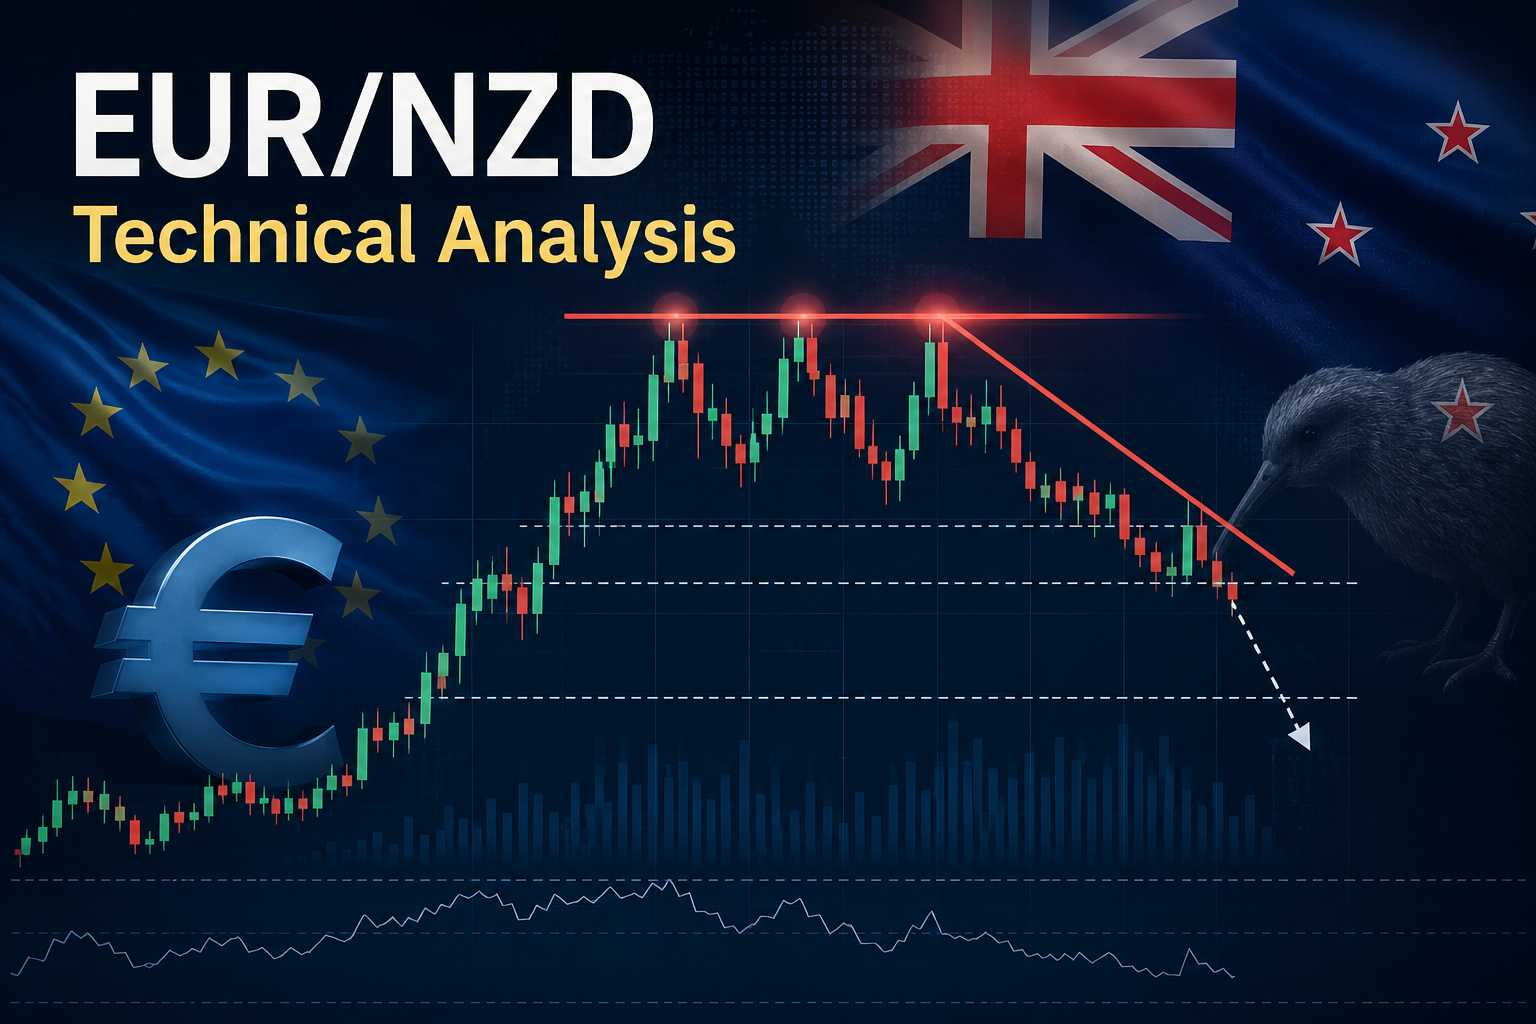
The dominant feature on the daily chart is the descending channel that has guided price lower since the November 2025 high. Each rally has so far failed at progressively lower highs, and the current test of the upper boundary near 1.9924 fits that pattern.
The channel is the anchor for the analysis. While price holds below 1.9924, the structure favours lower lows toward 1.9800 and beyond.
A clean daily close above that ceiling would be the first sign the pattern is breaking, bringing the channel top and the round 2.00 level back into focus.
The table below consolidates the main technical signals and the levels that frame them.
| Indicator | Current Signal | Trading Read-Through |
|---|---|---|
| Price action | Compressed between 1.9800 and 1.9924 | Breakout pressure building beneath channel resistance |
| RSI (14) | 39.8, below the midline but not oversold | Momentum leans soft, with room before exhaustion |
| MACD (12, 26) | -0.002, marginally below the zero line | Mild bearish bias; a positive crossover would neutralise it |
| ADX (14) | 33.1, above the trend threshold | Confirms a genuine trend rather than noise |
| Stochastic RSI | 15.5, oversold | A short-covering bounce toward 1.99 is possible |
| 50-day EMA | Mixed across data feeds | Bearish only on a confirmed close below it |
| 200-day EMA | Mixed across data feeds | A death cross applies only if the 50-day sits below it |
| ATR / volatility | Range has narrowed into the channel | Compression points to a likely volatility expansion |
| Immediate resistance | 1.9858 to 1.9924 | A daily close above 1.9924 reopens the channel top and 2.00 |
| Immediate support | 1.9800 | First downside objective on a break |
| Downside targets | 1.9700, then 1.9400 | Deeper supports if selling extends |
| Trend bias | Soft while capped below 1.9924 | Neutral-to-bearish unless 1.9924 gives way |
| Momentum bias | Mixed, oversold short term | Bounce risk inside a broader soft trend |
Because EUR/NZD nets the euro directly against the New Zealand dollar, it is a cleaner way to trade the ECB-versus-RBNZ divergence than working through dollar pairs.
Traders who want to play the channel, whether fading strength near 1.9924 or trading a break of 1.9800, can access EUR/NZD through EBC’s forex CFD range and take either side of the move from one account.
Momentum sends a split message. The RSI in the high 30s points to a soft but not exhausted market, while the Stochastic RSI in oversold territory flags short-covering risk, the kind of setup that often produces a relief bounce inside a downtrend rather than a clean reversal.
The ADX above 33 confirms the prevailing move has been a genuine trend.
The moving-average read is the main caveat. Some charting platforms show price below the 50- and 200-day EMAs with a death cross forming, while others read closer to neutral on the medium-term averages. Because the signal diverges by source, it is best confirmed on the trader’s own chart before it is leaned on.
Bearish continuation. The base case while the 1.9924 ceiling holds. A rejection at the channel top, followed by a break of 1.9800, would expose 1.9700 and then 1.9400. This path fits the channel structure and the softer end of the forecast range.
Short-term relief bounce. The oversold Stochastic RSI and a localised symmetric triangle on the 15-minute chart point to a possible push toward 1.99. That is a tactical move within the range, not a structural turn, unless it clears 1.9924 on a daily close.
Range and consolidation. The pair could simply keep chopping between support at 1.9800 and resistance at 1.9924 until the ECB or the RBNZ delivers a fresh catalyst.
The technical bias is soft, but the forecast picture is mixed rather than decisively bearish. Some models point toward the mid-1.95s by year-end, with one projection near 1.957 for December 2026, while others sit closer to 1.98 to 2.03.
The softer lean is often attributed to relatively firm RBNZ pricing, but that narrative is not one-sided. The ECB raised rates by 25 basis points on 11 June 2026, and the RBNZ held the Official Cash Rate at 2.25% on 27 May in a close-run decision, so both sides carry tightening risk.
These are interpretations of central-bank expectations rather than a confirmed path, and they can shift with each data release. For now they leave the pair on the back foot while 1.9924 holds, without making the medium-term direction a foregone conclusion.
Forecasts diverge widely, from the mid-1.95s (one model near 1.957 for December 2026) to above 2.00. Near term, the bias stays soft while 1.9924 caps the pair, with 1.9800, 1.9700, and 1.9400 the downside markers.
It is stuck under resistance at 1.9924 inside a descending channel, and a high ADX shows the prevailing move has been a genuine trend. The caveat is that moving-average signals differ by provider, so the read is not unanimously bearish.
Yes. An oversold Stochastic RSI and a short-term symmetric triangle point to a possible push toward 1.99. Unless price closes above 1.9924, though, that would be a relief move rather than a trend change.
EUR/NZD is soft but not decisively bearish. The descending channel and a strong ADX keep the pressure on the downside, while an oversold Stochastic RSI and a mixed moving-average picture argue against treating this as a clean downtrend.
The levels do the talking. While 1.9924 caps the pair, the downside markers are 1.9800, then 1.9700 and 1.9400. A daily close above 1.9924 would be the first real crack in the channel.
For traders ready to act on this structure, EUR/NZD is available as a CFD on EBC’s forex instruments page, tradeable long or short on MT4, MT5, and the EBC App. As a cross, it tends to run a wider daily range than the majors, so size positions with extra room around stops.