Published on: 2025-04-30
Updated on: 2025-04-30
In the crowded world of technical analysis, traders often rely on well-known tools to help identify trends, reversals and entry signals. Among the most popular are moving averages, a mainstay of trend-following systems. Yet a lesser-known but increasingly appreciated tool — the Aroon Indicator — offers a fresh perspective on trend strength and timing.
While both the Aroon Indicator and moving averages aim to guide traders through price action, they do so in notably different ways. Understanding their strengths and limitations is key to choosing the right tool for your strategy.

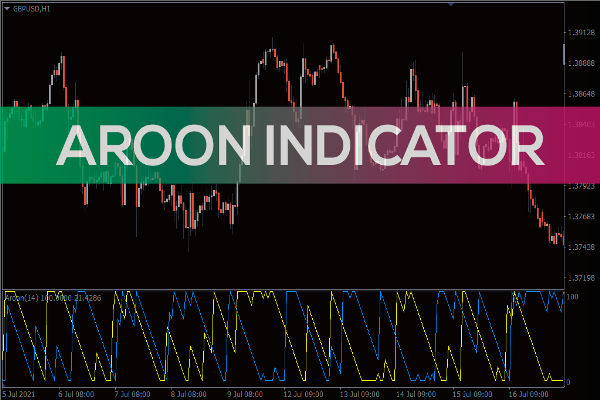
The Aroon Indicator was developed by Tushar Chande in 1995 to measure the strength of a trend and the time elapsed since a price reached a high or low. It consists of two lines — Aroon Up and Aroon Down — which move between 0 and 100. A strong uptrend is indicated when Aroon Up is close to 100, while a strong downtrend shows Aroon Down near 100.
Unlike moving averages that smooth out price over time, the Aroon Indicator focuses on timing. It answers the question: how recently has the price hit a high or a low?
Moving averages calculate the average closing price of an asset over a set number of periods. They are typically divided into two main types: simple moving averages (SMA) and exponential moving averages (EMA). Traders use them to identify the general direction of a trend, potential reversals and dynamic support or resistance levels.
While highly versatile, moving averages lag by nature. They rely on historical data, which means signals can appear after a trend has already started.
Both indicators offer insight into trends, but their approaches are fundamentally different:
Speed vs Smoothness: The Aroon Indicator reacts more quickly to recent highs and lows, whereas moving averages smooth out data over time, which can delay signals.
Signal Clarity: Aroon values tend to be more binary — showing clear dominance of buyers or sellers — while moving averages require crossovers or angles to interpret.
Visual Layout: Aroon lines oscillate within a defined range of 0 to 100, providing a visual sense of momentum and trend age, while moving averages sit on the price chart.
Timely Signals: The Aroon Indicator provides early clues about trend formation, often before moving averages signal a crossover.
Clear Trend Strength: Its values directly reflect how dominant a trend is. If Aroon Up is above 70 while Aroon Down is below 30, the uptrend is likely strong.
Avoids Lag: Since it measures time since recent highs or lows, it is more responsive to market changes compared to the average-based approach of moving averages.
Smooth Visuals: Moving averages are visually smoother, making it easier to spot long-term trends without getting caught in short-term noise.
Widespread Use: Most traders are familiar with them, which can contribute to self-fulfilling behaviours at key levels.
Multiple Timeframes: They can be applied to virtually any timeframe, from intraday to long-term investing.
Many traders use the Aroon Indicator as a standalone tool to determine when a trend is beginning or ending. For example, if Aroon Up crosses above Aroon Down and holds near 100, it could signal a fresh bullish trend. On the flip side, if Aroon Down rises and stays dominant, bearish momentum is likely building.
It is also effective in identifying consolidations. When both lines are low, it suggests a lack of recent highs or lows, hinting at sideways price action.
.png")
Rather than choosing one over the other, some traders combine both tools for confirmation. For instance, a bullish signal from the Aroon Indicator could be strengthened if it aligns with a moving average crossover or the price trading above a 50-period EMA. This layered approach can filter out false signals and improve confidence in trade setups.
However, using both means watching for confluence rather than contradiction. If the Aroon Indicator signals a trend while moving averages suggest a range, it may be wise to wait for further confirmation.
Overlooking Settings: The default period for the Aroon Indicator is 25, but adjusting it based on volatility and asset class can improve accuracy.
Ignoring Context: No indicator works in isolation. Always consider broader market trends, economic news and support/resistance levels.
Forcing Signals: Just because the Aroon lines cross does not guarantee a profitable trade. It is important to assess volume, price action and other supporting evidence.
If you prioritise speed and want to know how recently a trend has asserted itself, the Aroon Indicator may be your tool of choice. It is particularly useful in breakout or trend-trading strategies where timing is essential.
If you prefer to follow more established trends and value smoother price data, moving averages may be a better fit. They work well in systems designed to ride longer-term moves with fewer whipsaws.
Ultimately, the best choice depends on your trading style, risk tolerance and strategy. Some traders even switch between the two depending on the market conditions
Both the Aroon Indicator and moving averages have their place in technical analysis. They are not mutually exclusive, and each offers something different. The Aroon Indicator excels at identifying emerging trends quickly, while moving averages provide long-term clarity and confirmation.
For traders willing to experiment and refine their approach, combining these tools may offer the perfect balance of speed and reliability.
Disclaimer: This material is for general information purposes only and is not intended as (and should not be considered to be) financial, investment or other advice on which reliance should be placed. No opinion given in the material constitutes a recommendation by EBC or the author that any particular investment, security, transaction or investment strategy is suitable for any specific person.