Published on: 2025-09-11
Updated on: 2025-09-11
EMA crosses can highlight shifts in momentum, but they're not foolproof. Because they lag price, they often produce false signals in sideways markets. Traders usually combine them with tools like RSI, volume, or trend filters to confirm validity.
The EMA trading strategy uses the exponential moving average, which gives more weight to recent price data than the simple moving average (SMA), making it more responsive to current market conditions.
The EMA crossover strategy involves monitoring two or more EMAs of different timeframes to identify potential trading signals when one EMA crosses another.
Traders determine potential trends by observing the direction of the EMA lines and their position relative to the price chart, providing insight into market momentum.
Combining EMA with other technical indicators, such as the relative strength index (RSI) or moving average convergence divergence (MACD), can enhance the effectiveness of trend-following strategies.
Maintaining effective risk management, along with discipline, patience, and emotional control, is crucial for the successful application of any EMA-based trading strategy.

Financial markets are noisy by nature, full of fluctuations that mask underlying direction. Traders, therefore, lean on technical tools to help them interpret this chaos.
Among the most enduring is the Exponential Moving Average (EMA), a calculation that gives greater weight to recent price action and thus reacts faster than a simple moving average.
When two EMAs of different lengths intersect, traders watch closely.
A short-term EMA crossing above a long-term EMA often points to a shift in momentum towards strength, while the reverse may foreshadow weakness. This simple event — known as the EMA cross — has become one of the most recognised visual cues in technical analysis.

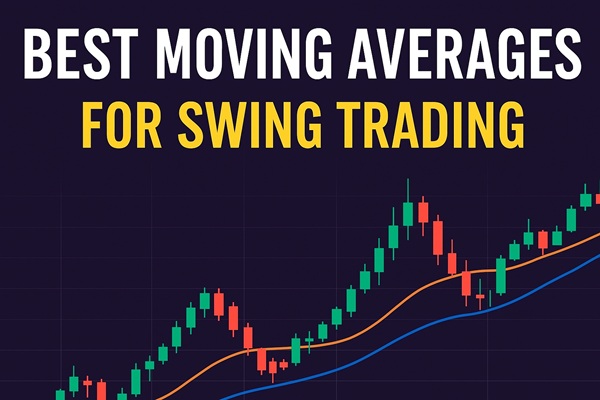
Different EMA pairings cater to different objectives. Short-term traders might favour the 9 and 20 EMA combination, capturing shifts on intraday or swing timeframes. Longer-term investors prefer the 50 and 200 EMA pairing, which filters out short-lived noise and focuses on broader market direction.
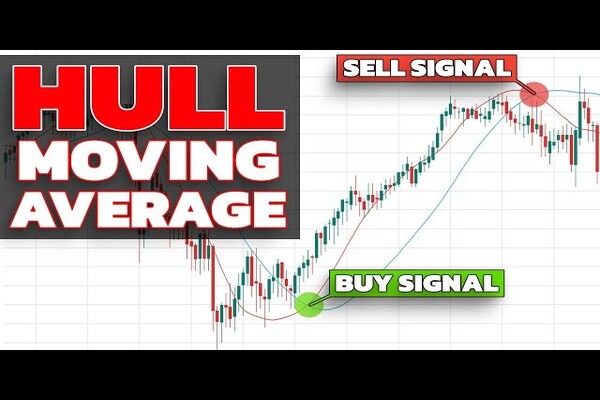
Two classic patterns stand out:
Golden Cross: when a shorter EMA rises above a longer EMA, often interpreted as a bullish trend signal.
Death Cross: when a shorter EMA falls below a longer EMA, frequently taken as a bearish warning.

Timeframe matters enormously. A golden cross on a five-minute chart may simply flag a fleeting bounce, whereas the same formation on a weekly chart can draw the attention of large funds and institutional players.
The textbook EMA cross strategy is straightforward: buy when the short EMA rises above the long EMA and sell when it falls below. Yet markets are rarely that simple, and experienced traders refine the approach.
1) Multiple EMAs:
Introducing a third EMA, such as a 20-50-200 combination, adds layers of context. Short and medium-term crosses are then assessed against the anchor of the long-term average.
2) Momentum Confirmations:
Pairing EMA crosses with indicators like the Relative Strength Index (RSI) ensures that signals are backed by actual strength or weakness rather than random noise.
3) Risk Management Overlays:
Dynamic stop-losses, often guided by volatility measures such as the ATR (Average True Range), prevent small reversals from turning into significant losses. Trailing stops allow profits to be captured during extended runs.
The key is integration. EMA crosses shine brightest not as a standalone compass but as part of a toolkit.
To implement an EMA cross system effectively, clarity and discipline are paramount. Traders typically:
Set up the chart with clearly distinguished EMAs, ensuring visual signals are unmistakable.
Define rules — for instance, only taking bullish crosses if price is already trading above the 200 EMA, thereby aligning with the dominant trend.
Filter entries with supporting evidence such as rising volume or RSI momentum.
Avoid choppy markets, where EMAs repeatedly intersect and signals lose meaning.
Different trading styles demand different interpretations. Scalpers may zoom in on one-minute or five-minute charts, while swing traders might wait for daily closes. The principle is universal, but its execution must match the trader's timeframe and temperament.
The EMA cross's greatest strength is its clarity. It strips away noise, translating complex price action into an intuitive visual cue. It works across asset classes, from currencies to commodities, and adapts to nearly any timeframe.
However, its simplicity is also its weakness. Because EMAs are lagging indicators, they react after price has already moved.
In sideways or range-bound conditions, crosses can multiply into false signals, leading to "whipsaw" trades. Furthermore, period selection can make the system either hypersensitive and noisy or sluggish and late.
In short: the EMA cross reveals trend, but only within the context of broader analysis.
Recent market events illustrate both the allure and the limits of EMA crosses. In cryptocurrency markets, Ripple (XRP) exhibited a bullish signal as the 20 EMA crossed above the 50 EMA, hinting at the end of a bearish cycle. Yet the signal only gained credibility when paired with positive sentiment and rising adoption data.
These case studies highlight a vital lesson: EMA crosses work best when the story they tell aligns with the broader market narrative.
For traders seeking to use EMA crosses effectively, several principles stand out:
Context is king: Always consider where price sits relative to longer-term EMAs before acting.
Confirm, don't assume: RSI, MACD, or volume should validate the crossover.
Test before trust: Backtest different EMA pairings on your chosen asset rather than relying on generic settings.
Protect every trade: Apply robust stop-loss and profit-taking strategies to avoid whipsaw losses or giving back hard-earned gains.
When treated as part of a disciplined process, EMA crosses become less about chasing signals and more about riding sustained trends.
Q1: What are the best EMA periods?
Short-term traders often favour 9 and 20 EMAs for agility, while long-term investors rely on 50 and 200 EMAs to capture major market moves.
Q2: Can EMA crosses be used on their own?
Not reliably. As lagging signals, they often produce false entries in sideways markets. Confirmation from other indicators is essential.
Q3: Why combine EMA crosses with RSI?
The cross signals direction, while RSI refines timing, highlighting when conditions are overbought or oversold. The combination improves accuracy.
Q4: When should EMA cross strategies be avoided?
They are less effective in low-volatility or sideways conditions, and risky during sharp, news-driven volatility spikes that distort price action.
The EMA cross is not a silver bullet but a lens. It frames market action in a way that is simple, visual, and repeatable. Alone, it offers guidance; when paired with supporting tools and strict risk management, it evolves into a robust compass for navigating markets. The real mastery lies not in watching lines cross, but in understanding the story those crossings tell.
Disclaimer: This material is for general information purposes only and is not intended as (and should not be considered to be) financial, investment or other advice on which reliance should be placed. No opinion given in the material constitutes a recommendation by EBC or the author that any particular investment, security, transaction or investment strategy is suitable for any specific person.