Published on: 2025-04-16
Updated on: 2025-10-07
The Hull Moving Average (HMA) acts like a noise-cancelling filter for your charts. Instead of getting distracted by every price fluctuation, it highlights the real direction of the trend.
Unlike traditional moving averages that can lag or give conflicting signals, the HMA reacts faster while keeping the chart smoother. For traders, this means spotting momentum changes earlier, avoiding false signals, and gaining a clearer view of market direction.
The HMA is a trend-following indicator designed to combine the best of responsiveness and smoothness. While traditional moving averages like SMA and EMA can lag or oscillate with noise, the HMA is built to reduce both delay and jitter.
 It does this by chaining together weighted moving averages (WMAs) and smoothing them in a unique formula, making its line adapt quickly to market changes while offering a cleaner visual trend track
The HMA is calculated using a multi-step process:
Start with a Weighted Moving Average (WMA) that gives more importance to recent prices.
Compare a short-term WMA (half the period) with a longer-term WMA (the full period).
Combine the two by doubling the short-term value and subtracting the long-term value.
Smooth the result again using another WMA, this time based on the square root of the period.
Put simply: the HMA speeds up reaction to price changes (like a short-term average) while staying smooth (like a long-term average).
HMA Formula:
HMA(n) = WMA( 2 × WMA(n/2) – WMA(n) ), √n
Where:
WMA = Weighted Moving Average
n = chosen period (e.g., 9, 21, 50)
This calculation method allows the HMA to respond quickly to price changes while filtering out much of the market noise that can lead to false signals.
The HMA stands out because it combines speed and smoothness, giving traders a reliable way to read trends. Its main advantages include:
Reduced Lag: Reacts more quickly to price changes than traditional moving averages, allowing traders to spot new trends earlier.
Smoothness: Filters out small price fluctuations, making the overall trend easier to see.
Versatility: Works across different markets and timeframes whether you trade forex, stocks, indices, or commodities.
Clear Signals: The slope and direction of the HMA line provide simple, visual cues for following trends or spotting reversals.
Identifying Trends
The HMA makes it easier to spot the overall market direction. An upward-sloping HMA suggests an uptrend, while a downward slope signals a downtrend. Because it reacts quickly, traders can detect trend reversals earlier than with many other moving averages.
Finding Entry and Exit Points
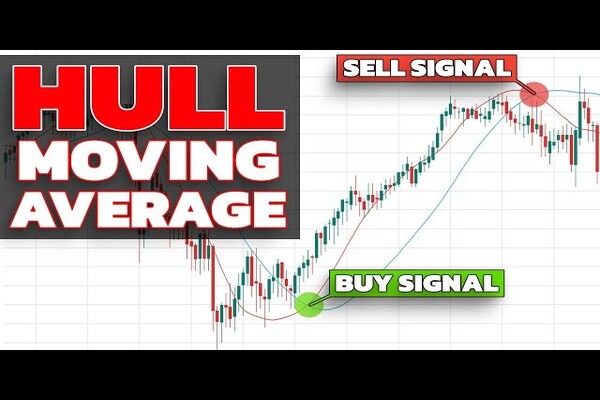
Traders often use price interactions with the HMA for signals:
Buy signal: Price crosses above the HMA.
Sell signal: Price crosses below the HMA.
HMA crossover strategy: A short-period HMA crossing above a longer-period HMA indicates a possible buy; the opposite suggests a sell.
Filtering Market Noise
In choppy or sideways conditions, traditional moving averages may create false alerts. The HMA smooths out price action, helping traders focus on genuine moves instead of whipsaws.
Pairing HMA with Other Indicators
The HMA is most effective when combined with other tools. For example:
HMA + RSI: Confirms trend direction with momentum strength.
HMA + MACD: Adds depth to trend-following strategies.
HMA + volume analysis: Validates breakouts or continuation moves.
Imagine a stock drifting between $50 and $52 for days. You apply the 20-period HMA. When price breaks and crosses above HMA with volume, it rises to $55. A trader could have entered at that crossover and used the HMA line or recent low as a stop.
That’s using HMA to catch a real trend instead of noise.
Short periods (e.g. 9, 14): Fast reaction, suitable for day trading.
Medium periods (e.g. 21, 50): Balanced for swing setups.
Long periods (e.g. 100, 200): Used to confirm strong, longer trend direction.
Shorter periods = more responsive but risk more false signals. Longer periods = more stable but slower to show change.
When choosing a moving average, traders often compare the Hull Moving Average (HMA) with the more common Simple Moving Average (SMA) and Exponential Moving Average (EMA).
| Feature | HMA (Hull Moving Average) | SMA (Simple Moving Average) | EMA (Exponential Moving Average) |
|---|---|---|---|
| Speed & Smoothness | Less lag + smoothed line | Smooth but lagging | Responsive, may be choppy |
| Best Use Case | Trend detection with less noise | Long-term smoothing | Trend and momentum mixing |
| Risk in Ranges | Still may misread sideways moves | More stable in ranges | More false crossovers in volatile ranges |
Understanding these distinctions helps traders match the right moving average to their style and market conditions.
While the Hull Moving Average is faster and smoother than traditional averages, it isn’t flawless.
In sideways markets, it can still produce misleading signals that may trick traders into entering too early. On highly volatile instruments, the HMA may react too often, creating unnecessary noise. For this reason, it’s best used in combination with other indicators or confirmation tools, rather than as a standalone decision-maker.
HMA is used to detect trends early, filter noise, and provide sharper signal clarity compared to standard averages.
HMA is often faster and smoother than EMA in certain market conditions, but both have trade-offs. EMA may be less volatile in some cases.
Short (e.g. 9, 14) for fast setups; medium (21–50) for balance; long (100, 200) for trend confirmation.
Yes. Many traders apply HMA to forex, crypto, stocks, and more to improve trend clarity.
It is recommended to pair it with momentum indicators, volume analysis, or trend filters for more reliable signals.
The Hull Moving Average is more than just a technical indicator. By combining speed, smoothness, and adaptability, it helps forex traders identify trends with clarity and confidence. When paired with smart risk management and supporting tools, the HMA can become a valuable part of a trading strategy designed for today’s fast-moving markets.
In fast markets like 2025, mastering HMA setups; whether crossovers, slope tracking, or filters can make a real difference in how early and how cleanly you enter and exit trades.
Disclaimer: This material is for general information purposes only and is not intended as (and should not be considered to be) financial, investment or other advice on which reliance should be placed. No opinion given in the material constitutes a recommendation by EBC or the author that any particular investment, security, transaction or investment strategy is suitable for any specific person.