Published on: 2025-09-11
Updated on: 2026-08-07
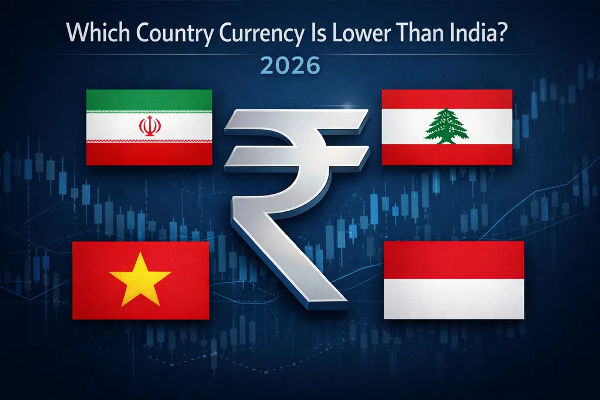
₹1 now buys roughly 14,400 Iranian rials, putting Iran first in the latest world lowest currency vs Indian rupee ranking. One rupee buys more than 15 times as many Iranian rials as Lebanese pounds, the second-ranked currency. Vietnam and Paraguay also sit near the bottom by unit value without sharing Iran’s currency-crisis dynamics.
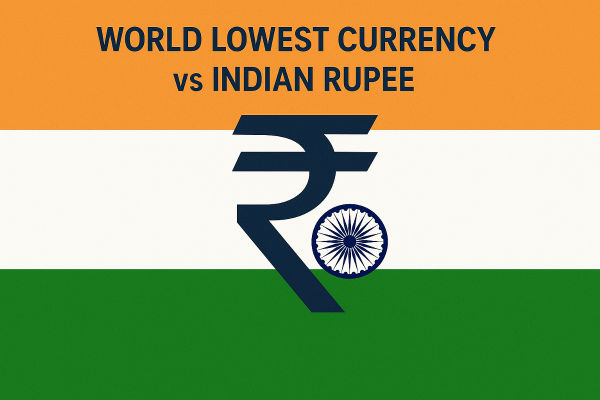
Iran ranks first at roughly 14,400 IRR per ₹1 under current market-rate comparisons.
Vietnam ranks third despite projected 7.1% economic growth in 2026, showing that low nominal value and economic weakness are different measures.
Sierra Leone’s old SLL figures are obsolete after 1 new SLE replaced 1,000 old leones in the 2022 redenomination.
South Sudan’s position is less certain because SSP exchange-rate quotes vary sharply between providers.
INR has weakened about 5.6% against USD in 2026, so movements in the rupee can change every conversion in the ranking.
The ranking shows how many units of each currency ₹1 bought on 6–7 August 2026 using representative market or mid-market rates. Figures are rounded, and controlled or thinly traded currencies can vary between providers.
| Rank | Currency | ₹1 Buys |
|---|---|---|
| 1 | Iranian rial | ~14,400 IRR |
| 2 | Lebanese pound | ~940 LBP |
| 3 | Vietnamese dong | ~275 VND |
| 4 | Lao kip | ~237 LAK |
| 5 | Indonesian rupiah | ~188 IDR |
| 6 | Uzbekistani som | ~125 UZS |
| 7 | Guinean franc | ~92 GNF |
| 8 | Paraguayan guarani | ~62 PYG |
| 9 | South Sudanese pound | ~53 SSP |
| 10 | Malagasy ariary | ~45 MGA |
The Cambodian riel sits just outside the top 10 at roughly 43 KHR per ₹1. South Sudan’s ninth-place position is less certain because SSP quotes vary sharply between providers, so its rank can change depending on the rate source used.
Iran’s position reflects more than large banknote denominations. The IMF projects inflation near 69% in 2026, while sanctions, exchange controls and weaker economic activity continue to pressure the rial.
Iran also uses multiple exchange rates. Rankings based on official rates can therefore differ sharply from those using market prices, which explains why some lists still place Lebanon below Iran differently.
Lebanon’s pound remains second in the ranking after years of banking-system stress, capital controls and a collapse in the currency’s value. Its current nominal level reflects the lasting effects of that crisis rather than the denomination structure seen in currencies such as the Vietnamese dong.
That distinction separates Lebanon from Iran. Both currencies sit at extremely low nominal values, but Lebanon’s position largely reflects an earlier repricing of the pound, while Iran continues to face intense inflation and exchange-rate pressure.
Vietnam is the clearest counterexample. The dong ranks third at roughly 275 VND per ₹1, yet the IMF expects Vietnam’s economy to grow about 7.1% in 2026. Vietnam’s low unit value reflects how the dong is denominated, not the kind of currency crisis affecting Iran.
The Paraguayan guarani also ranks near the bottom even though it has strengthened against the US dollar during 2026. Nominal value alone does not show whether a currency is weakening or whether the economy behind it is growing.
Older rankings often show hundreds of Sierra Leonean leones per Indian rupee. Those figures use the former Sierra Leonean leone, or SLL.
Sierra Leone redenominated its currency in 2022, replacing 1,000 old SLL with 1 new leone, or SLE. The redenomination removed three zeros without making the currency 1,000 times more valuable in real terms.
Current mid-market rates put ₹1 at only about 0.24 SLE. Any modern ranking still showing hundreds of Sierra Leonean leones per rupee is using an obsolete currency unit.
A foreign currency can barely move and still change position in this ranking if the rupee rises or falls.
USD/INR reached about ₹96.88 on 23 July 2026, after trading near ₹89.87 earlier in the year. By 7 August, INR was about 5.6% weaker against the US dollar than at the start of 2026.
A weaker rupee means ₹1 buys fewer units of every foreign currency, even when those currencies are broadly unchanged.
Under current market-rate comparisons, the Iranian rial ranks first, with ₹1 buying roughly 14,400 IRR. The Lebanese pound is a distant second at around 940 LBP per ₹1.
Iran uses multiple exchange rates, and official rates can differ sharply from market prices. Rankings based on official rates may place Lebanon first, while current market-oriented comparisons put the Iranian rial considerably lower.
No. “Lowest” here refers to nominal unit value against INR. A currency can have a very low face value without being the worst economic performer, which is why the Vietnamese dong can rank near the bottom without being in crisis.
No. Exchange-rate size does not measure local purchasing power. Prices, wages, inflation and living costs determine how expensive a country is, not the number of currency units received for ₹1.
Official rates, market rates, thin liquidity and redenominations can all change the result. Iran shows the official-versus-market-rate problem, while Sierra Leone shows how an outdated currency unit can make a ranking wrong even when the arithmetic is correct.
The RBI’s next Monetary Policy Committee meeting runs from 5–7 October 2026, giving the rupee its next scheduled domestic policy test. The table can still change before then if INR moves sharply or official exchange rates in countries such as Iran are adjusted.
A low exchange-rate value ranks the currency unit. It does not rank the economy behind it.
Disclaimer: This material is for general information purposes only and is not intended as (and should not be considered to be) financial, investment or other advice on which reliance should be placed. No opinion given in the material constitutes a recommendation by EBC or the author that any particular investment, security, transaction or investment strategy is suitable for any specific person.