As the saying goes, spring river, this is what water warms the duck prophet. When the stock price begins to change, in fact, there are such special patterns in the technical indicators that can be prophetic of the stock price trend, such as the golden cross and death cross. They are an overbought signal and an oversold signal. Both allow investors to grasp the trend in advance so as to make buy-and-sell decisions. Now let's talk specifically about what to pay attention to, the identification of the dead cross, and buying and selling decisions.
 What is Dead Cross?
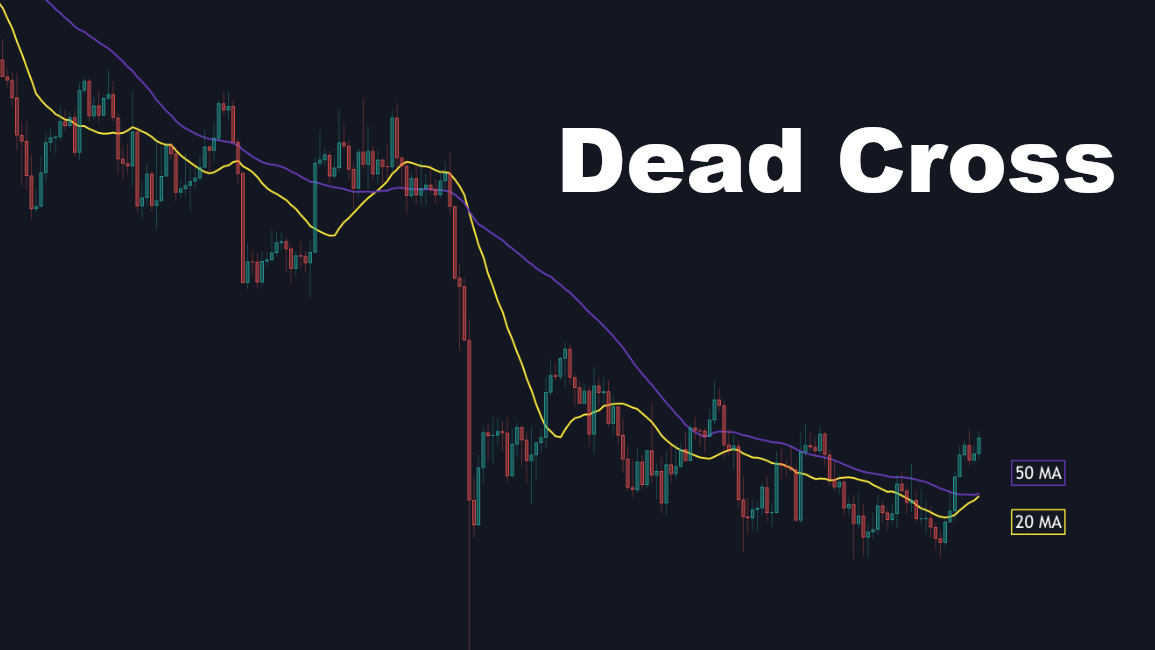
In technical analysis, the "Death Cross" refers to a pattern where two different moving averages cross on a price chart, signaling a potential downtrend. Specifically, the Death Cross occurs when a shorter-term moving average, like the 50-day SMA, crosses below a longer-term moving average, such as the 200-day SMA, suggesting bearish momentum. Conversely, when a shorter-term average crosses above a longer-term one, it forms a "Golden Cross," often seen as a bullish indicator.
In essence, the Death Cross signals possible downward momentum, while the Golden Cross indicates potential upward momentum.
Of course, not only in the averages, but also in the macd indicator (Moving Average convergence dispersion), the kdj indicator, etc., will continue to form such a cross signal. Generally speaking, as long as the line of indicators appears to cross now, it is uniformly referred to as the golden cross and dead cross.
For example, the MACD indicator has two lines: a DIF line and a DEA line. Generally speaking, the DIF line is called the fast line, or, in other words, the average price movement of the recent period of smoothing. The DEA line is called a slow line and represents the trend curve over a longer period of time.
If the DIF line (fast line) is crossing the signal line (slow line) from above to below, it is a death cross. The stock may be about to start a downward breakout or enter a medium-term downtrend.
That being said, when all the shorter-period, i.e., faster-running lines, go up and cross the major-period line, it's basically referred to as a golden cross. And when the minor-period line goes down and crosses the major-period line, it's called a death cross.
As the name suggests, the golden cross uses gold to represent the probability of making money, while the death cross uses death to represent the risk of such a meaning. So in the application, investors generally take the golden cross as a signal to go up and the death cross as a signal to go down.
The reason is that small-period level lines are more sensitive to price movements. So when the stock price starts to rise, it is definitely the short-term averages that change faster. That means that when the short-term average price rises, it means that the stock price is probably rising. So a short-term average going up through a long-term average is a buy signal, while a short-term average going down through a long-term average is a sell signal.
It should be noted that sometimes the five-day ten-day because the level is not really big, so in the disk it will also appear a certain amount of down through. But this time the formation of the cross will not be all as a death cross, and there is no reference significance. Generally speaking, when the signal of the death cross appeared in the high level, more attention was paid to it, and when the signal of the golden cross appeared in the low level, its value was greater. It appeared in the middle of the region of the cross reference significance of a little.
Generally speaking, it is the averaging system when there is a golden cross and a death cross. But for the indicator system, it still depends on the position. That is, the golden cross must be the lower the better, and the death cross must also be the higher the better.
For example, the KDJ is made up of three lines, the fastest of which is the K line, and the slowest is the D line. If the fastest line goes under the slowest line, then this place is a death cross, which means that this is a sell point. However, it should be noted that the indicator of this death cross must pay attention to the location of the KDJ's golden cross; generally speaking, it is to look for 20 below the golden cross to prevail, while the death cross is generally to look for 80 above the golden cross to prevail.
Although the dead cross phenomenon is considered to be a signal of a possible change in market trend, it is also often seen as a potential sell signal, as it suggests that the short-term price action may turn downward. However, it is important to note that it is not an absolute predictive tool. You can't just rely on a simple signal like a golden cross or a death cross; you need to combine more technical analysis skills to make an overall judgment.
The difference
between a dead cross and a golden cross
| Aspects |
Death Cross |
Golden Cross |
| Definition |
Short-term SMA crossing the long-term SMA |
Short-term averages crossing long-term averages |
| Meaning |
Bear signal, possible downtrend |
Bullish signal, possible uptrend |
| Moving Average |
Usually involves 50 and 200 day SMAs |
Usually involves the 50-day SMA crossing the 200-day SMA |
| Time Frame |
Applicable to any time frame (daily, weekly, monthly) |
Applicable to any time frame (daily, weekly, monthly) |
| Frequency |
Occurs less frequently than a golden cross |
Occurs less frequently than a dead cross |
| market sentiment |
Indicates a shift in market sentiment in a negative direction |
Indicates a shift in market sentiment in a positive direction |
| Trading Strategies |
Traders may consider going short or taking a defensive position |
Traders may consider buying or taking more aggressive positions |
What is the death cross and bullish divergence?
This refers to the combination of two Chart Patterns, a death cross and a bottom divergence, and is a phenomenon that suggests uncertainty in the market. It refers to a bottom divergence formed by the Relative Strength Index (RSI) or other indicators at the same time that a death cross (a short-term moving average crossing under a long-term moving average) is formed on a stock chart in technical analysis.
Bottom divergence is the formation of a relative low on the stock chart; that is, the price reached a certain level of the bottom. Technical indicators that form an opposite trend to the bottom price, such as the RSI, appear at a relatively high level when the trough is formed. It indicates that even though the stock price formed the bottom of a downtrend on the chart, the technical indicator signals that the market may be ushering in an uptrend.
That is, in this combination. First, the death cross is usually seen as a signal of a possible downtrend, while the bottom divergence is seen as a signal that the market may be ushering in an uptrend. This scenario suggests that despite the formation of a death cross on the stock chart as a sign of weakening buyers, However, the technical indicators show that the seller's side of the market may be weakening, and there may be signs of a trend reversal.
Investors may interpret the dead cross bottom divergence as a sign that the market may be ushering in an uptrend and therefore may consider adopting a bullish strategy accordingly, such as buying or taking a more aggressive position. However, it should be noted that market behavior is complex and a single signal is not always absolutely accurate. It is best to combine such signals with other technical indicators and fundamentals to make a more comprehensive analysis and decision.
What is the death cross and bearish divergence?
It refers to the formation of a death cross (MACD line going under the signal line) on a stock chart at the same time that the Relative Strength Index (RSI) or other indicators form a top divergence from the stock price in technical analysis. This type of divergence signals an inconsistency between the price trend and the technical indicators and may suggest some uncertainty or a potential trend reversal in the market.
Top divergence is the formation of price peaks in technical analysis, the stock chart at the same time, the relative strength index (RSI), or other indicators to form a divergence, that is, the indicator in the formation of the trough. That is, the stock chart formed a relatively high price point; that is, the price reached a certain high point. And the technical indicator that corresponds to the price peak, such as the RSI, appears to be at a relatively low level at the time of the formation of the peak.
A top divergence may suggest that although the stock price has formed an uptrend on the chart, the technical indicators show that the buyer power in the market may be weakening and there may be signs of a trend reversal. It is also accompanied by a death cross as a possible downside signal, so it is usually seen as a more obvious bearish signal. This type of divergence may suggest potential uncertainty in the market, as the divergence between the technical indicators and the price action may indicate that the strength of the trend may be weakening and there may be signs of a trend reversal.
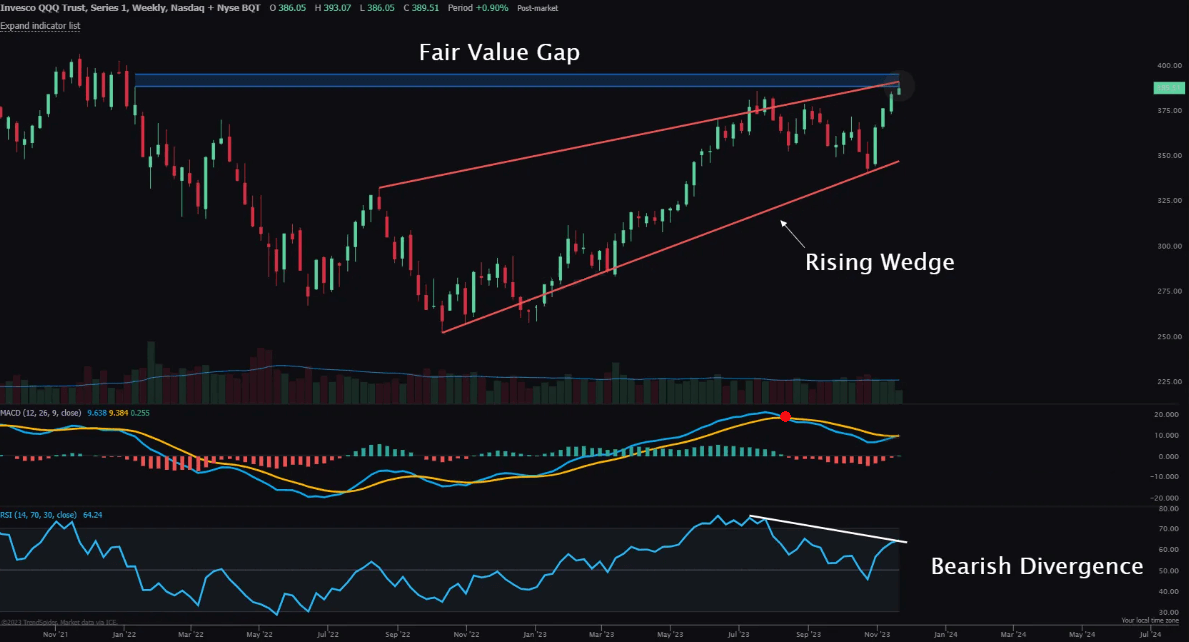 As seen in the chart above, there is a clear RSI top divergence, which means that while the stock is in an uptrend, the rsi indicator is showing a downtrend. At the same time, the MACD crossover line appears to be a high death cross, which is a clear signal of a downtrend. Therefore, in this wave, investors may adopt a bearish strategy accordingly, such as considering going short or taking a conservative position.
In the case of a dead-cross top divergence, investors may take a cautious approach to market changes and consider potential risks. It is best to combine such signals with other technical indicators and fundamental factors to make a more comprehensive analysis and decision.
Buy or sell on the death cross and top-back?
It is often seen as a potentially bearish signal, in which case investors may be inclined to take a cautious stance and consider selling their holdings or adopting a risk-aversion strategy. This is because a death cross and a top divergence together suggest that the market may be heading for a downtrend, and investors may want to cut their losses or hedge their risks.
However, the exact buy or sell depends on the investor's strategy and judgment. For example, an investor who believes it signals a market correction or reversal, and the oversold signal indicates that the market may have been oversold, may consider buying into the stock in anticipation of a price rebound. If one is pessimistic about the market trend and believes that death crosses and tops and backs are signals of a downtrend, one may choose to sell or adopt a defensive strategy.
And any buying or selling decision should take into account other factors, including overall market conditions, company fundamentals, and so on. For example, when death crosses and top-backs occur, watch the movement of the major market indices to confirm whether there is overall market pressure. If the overall market is in a downtrend, then death crosses and top divergences may reinforce pessimism and may favor selling.
It is also important to pay attention to the company's fundamentals, e.g., you can find out the outlook of the stock's industry and whether the industry is facing challenges or opportunities. There is also an examination of the company's outlook for future performance and whether there is good potential for growth. The financial statements of the company can also be analyzed to see its financial health. This includes the income statement, balance sheet, and cash flow statement to ensure that the company is in good financial health.
Other technical indicators or patterns can also be used to confirm death crosses and top divergence signals to increase the reliability of the decision. Support and resistance levels in the price action should also be taken into account to determine possible price rally or down points.
Finally, it is also important to develop a buying and selling strategy based on the investor's objectives and risk appetite. For example, determine the time frame of the investment, whether it is a long-term investment or a short-term trade. For long-term investment, you can buy and wait for the market trend to change before selling to make a profit on the spread. For short-term trading, you can choose to sell and then buy at a lower level and wait for the price to rise to sell.
It is worth emphasizing that any decision involves risk; it is recommended to fully understand the market and the company's situation before making trading decisions. Investors can also evaluate the authenticity and impact of the Dead Cross Top Divergence signal more fully based on a combination of factors.
Can you still buy
stocks with dead crosses?
| Considerations |
Explanation |
| Trends |
Confirms whether the overall market trend is bearish. |
| Other Indicators |
Confirm in conjunction with other technical indicators. |
| Fundamentals |
Consider the company's financial and business position. |
Disclaimer: This material is for general information purposes only and is not intended as (and should not be considered to be) financial, investment, or other advice on which reliance should be placed. No opinion given in the material constitutes a recommendation by EBC or the author that any particular investment, security, transaction, or investment strategy is suitable for any specific person.


 What is Dead Cross?
 As seen in the chart above, there is a clear RSI top divergence, which means that while the stock is in an uptrend, the


