Published on: 2026-03-18
A sideways market, often called “chop”, is one of the most misunderstood and frustrating conditions in trading. Unlike strong bull or bear markets, where direction is clear, sideways conditions trap traders in repetitive price movements with no sustained trend.
Yet, these markets are far from insignificant. They represent periods of consolidation, indecision, and preparation for the next major move. For disciplined traders, understanding sideways markets is not optional; it is essential.
This guide provides a practical and strategic understanding of sideways markets, including how to identify them, why they occur, and how to trade or avoid them with confidence.
A sideways market occurs when the price moves within a defined range without a clear trend.
It reflects a balance between buyers and sellers, often driven by uncertainty.
These markets are defined by support and resistance, weak momentum, and choppy price action.
Trading requires precision, patience, and strategies different from those used in trending markets.
Sideways conditions often precede major breakouts, making them critical to monitor.
A sideways market is a condition in which the prices move within a horizontal range without forming a sustained upward or downward trend.
In this environment, buyers and sellers are in relative equilibrium, preventing the price from moving decisively in either direction. As a result, the market produces a range-bound structure rather than a clear trend.
In simple terms, a sideways market is one in which the price moves neither up nor down.
Horizontal Price Movement: Prices fluctuate within a defined range
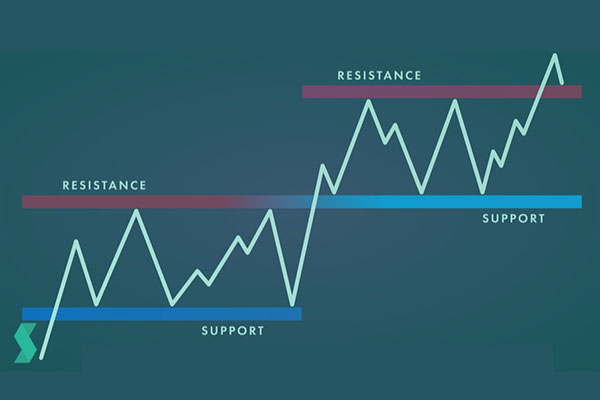
Support and Resistance: Clear levels where price repeatedly reverses
Low Trend Strength: Indicators show weak or fading momentum
Choppy Price Action: Frequent reversals and false signals
Balanced Supply and Demand: Buyers and sellers are evenly matched
Sideways markets can be viewed as a temporary equilibrium in which neither bulls nor bears have enough conviction to drive a trend.
Sideways markets are a natural part of market cycles and typically occur for several reasons:
After a strong rally or decline, markets often pause as traders lock in profits and reassess positions.
When economic data, earnings outlooks, or policy direction are unclear, participants hesitate to commit.
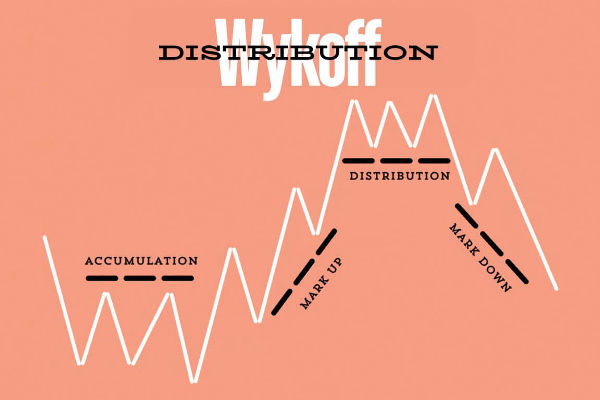
Large institutions may gradually accumulate or distribute positions to avoid aggressive price moves.
Without significant news or events, markets lack the momentum needed to trend.
Even strong, established companies can experience prolonged sideways phases.
Examples include Lockheed Martin Corporation, Northrop Grumman Corporation, and RTX Corporation.
These stocks may trade sideways during:
Stable earnings periods
Low macroeconomic volatility
Waiting phases before major contracts or policy developments
This reinforces a key insight: Sideways markets are not a weakness; they are preparation phases.
Sideways markets are mentally demanding because they create false expectations and repeated frustration.
Traders often:
Enter trades prematurely.
Overtrade due to boredom.
Get stopped out frequently.
Chase false breakouts.
This is why sideways markets are often described as “The market’s way of shaking out impatient traders.”
Price repeatedly bounces between support and resistance.
Moving averages flatten and overlap.
Indicators such as ADX show weak trend strength.
Absence of consistent higher highs or lower lows.
Frequent reversals within a narrow range.
Smaller candlestick bodies.
Stable or declining volume.
Lack of strong conviction from buyers or sellers.
Trading in sideways conditions requires a different approach from trend-based strategies.
Buy near support.
Sell near resistance.
Avoid trading in the middle of the range.
Assume the price will revert to its average.
Use indicators such as RSI or Bollinger Bands.
Wait for a confirmed breakout beyond the range.
Validate with volume and momentum.
Avoid reacting to false breakouts.
In many cases, the most effective decision is to stay out. Sideways markets often reward patience over action.
Focus on Levels, Not Direction: Support and resistance are more important than predicting trend direction.
Be Selective: Only take trades at high-probability zones near key levels.
Manage Expectations: Profits are typically smaller and slower in range-bound markets.
Control Position Size: Reducing exposure helps manage frequent reversals.
Wait for the Breakout: The largest opportunities often come after the sideways phase ends.
A sideways market is when prices move within a fixed range, neither trending upward nor downward. It reflects a balance between buyers and sellers, resulting in limited price movement and no clear direction.
A sideways market is neither inherently good nor bad, but it is more challenging. It offers smaller profit opportunities and requires different strategies, such as range trading, rather than trend-following.
Sideways markets can last from a few days to several months. Their duration depends on market conditions, economic uncertainty, and whether new catalysts emerge to drive a breakout.
Range trading is often the most effective strategy. Traders buy near support and sell near resistance while avoiding trades in the middle of the range, where risk-to-reward is less favourable.
Yes, sideways markets often signal consolidation before significant breakouts. Once new momentum or information enters the market, the price can move strongly in a new direction.
A sideways market, or “chop,” is a challenging but essential phase in financial markets. It reflects indecision, balance, and consolidation, where price moves within a defined range rather than trending.
For many traders, these conditions are frustrating. However, experienced participants recognise that sideways markets offer clear levels, valuable insight into market sentiment, and early signals of future breakouts.
Success in these environments is not about forcing trades or predicting direction. It is about adapting strategy, managing risk, and exercising patience. Because in trading, the goal is not just to profit in ideal conditions, but to survive the chop and be ready when real opportunities emerge.
Disclaimer: This material is for general information purposes only and is not intended as (and should not be considered to be) financial, investment or other advice on which reliance should be placed. No opinion given in the material constitutes a recommendation by EBC or the author that any particular investment, security, transaction or investment strategy is suitable for any specific person.