Published on: 2024-01-26
Updated on: 2025-10-02
In the stock market, many people are accustomed to making profits based on market trends. How else can we say it is a trend? Only by going with the trend can you make money peacefully and not be washed away by going against the current. Also for this reason, many technical analyses have indicators to determine the trend. Today, let's talk about how one of them, the ROC indicator, can be used for trend analysis?
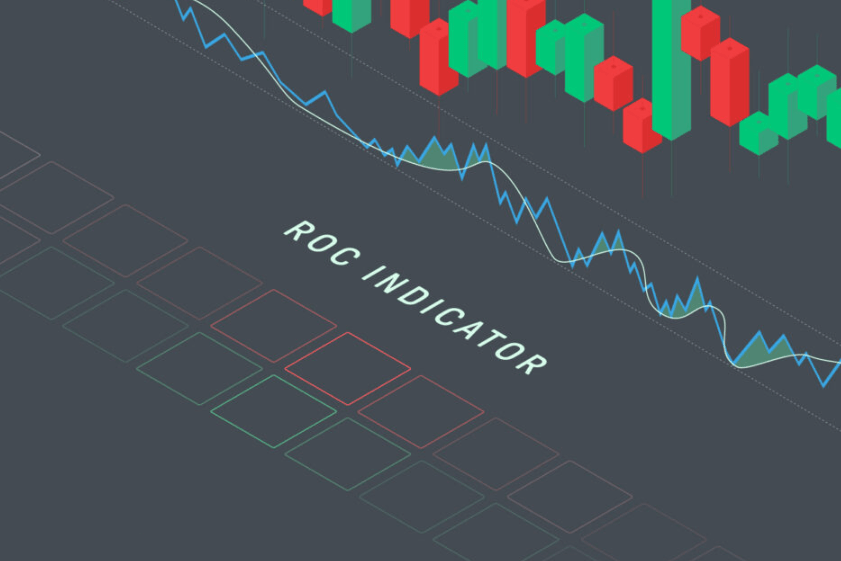
 ROC indicator
Its full name in English Rate of change, Chinese is the meaning of the rate of change. The rate of change is an indicator that reflects the speed of market price changes, also known as ROC, and is often used as a momentum indicator because it measures the speed of price changes.
Usually in the analysis of the market often hear two words, one is called change, the other is called volatility. Don't look at these two words in Chinese means about the same, but in the stock market can be a big difference. Generally speaking, change is to say that the price relative to the previous period of time, while the volatility can be interpreted as the meaning of risk.
In the financial news can often be seen, for example, U.S. stocks closed up 1%, or gold closed down 1% and other information. The decline is in fact compared to a previous period, and generally in the financial data reports, he took and the previous day compared.
There's a plus sign and a minus sign, and a plus sign means up, and a minus sign means down. Volatility is actually a measure of the speed of change, think of volatility as a description of change, and it measures the uncertainty of returns.
It is a momentum indicator used to measure the speed of price change over a period of time, and its moving trend indicates the trend of price change. Its traditional parameters are usually 7. 9 and 14.The fewer the parameters, the more responsive it is to trends. In short-term trading, the tendency is to use finer parameters, but when judging longer-term market conditions, 50. 100 and 200 can be used.
The value of the indicator has no upper limit and can be greater than 100. but has a lower limit of up to -100. and the mid-range dividing line, which is zero. Generally speaking, when its value is positive, it means that prices are rising, representing favorable market conditions and an upward trend. On the contrary, when it is negative, it means that the price is falling, which means that market conditions are negative and a downward trend is occurring.
It is used to predict future price movements by comparing the price of the day with the price of a particular day before a specific number of days, so it can be used to grasp the timing of buying and selling. When it breaks above the zero line, it represents a stronger buyer and may be a signal to buy. On the contrary, when it breaks through the zero line downward, on behalf of the seller is stronger, may be a signal to sell.
And when it rises to a relatively high position, it is overbought and is usually considered a sell signal. Conversely, when it falls to a relatively low level, it is oversold and is usually seen as a buy signal. In most cases, it moves in a similar direction to the price trend.
However, if its curve on the chart is trending upward and the price curve shows a certain deviation below a certain level, this is considered a buy signal. On the contrary, if its curve on the chart is trending down and the price curve shows a certain divergence above a certain level, this is considered a sell signal.
In other words, the ROC indicator is mainly used for trend analysis. When it is above the 0-axis in a continuing upward trend, it can be predicted that the price will go up. Conversely, when it is below the 0-axis and continues to fall, it can be predicted that the price will go down. Also when the price is in a consolidation period, it fluctuates around the 0-axis. It is important to note that if you are capturing a longer term trend, it is recommended to use larger parameters. This is because when the market does not have a clear direction, its value will constantly break the zero line up and down, generating false signals.
| Aspects | Description |
| Calculation Methods | Uses a percentage change formula for variable shifts over time. |
| Trend Analysis | High positives: up, low negatives: down. |
| Momentum Indicators | Measures price change speed, high values mean faster movement. |
| Buy and Sell Signals | Indicates buy/sell signals; e.g., positive shift may suggest buying. |
| Applicable Period | Suitable for various analysis durations based on investment goals. |
ROC Indicator Formula
The Rate of Change indicator mainly uses the comparison of the current price with the previous price to analyze the direction and strength of the trend. Its formula is: Rate of Change = (Today's closing price - n days ago closing price) ÷ n days ago closing price x 100
Where n is the period parameter of the rate of change indicator, indicating that to measure the price change today and n days ago. And if today has not yet closed, it can be expressed in terms of the current price. In short, it is to compare the current closing price with the previous closing price within a certain period, and then calculate the percentage of price change.
Because it applies to different trading markets and different time frames, the period parameters can be changed according to actual needs, with common values of 9. 21 and 50. Its value reflects the percentage change in price, which can help analyze the trend and momentum of the price.
The result of the calculation of the rate of change can be positive or negative, depending on the current price relative to the past price rise or fall. Generally, a positive number indicates an increase and a negative number indicates a decrease. The larger the value, the greater the price change. It is also possible to determine the trend of the market, and the rate of price change, based on its value.
A large positive value of the rate of change may indicate strong market momentum, while a large negative value may indicate weakening market momentum. Investors can use it to capture upward and downward market momentum. It is also commonly used to spot price trend divergences, where price and the rate of change indicator move out of sync, which may signal a trend reversal.
To summarize the ROC indicator works better in trending markets, but it is important to note that while it is very useful, it may not be enough on its own to make a complete trading decision.

How to use ROC index
As a technical indicator used to measure the rate of price change, the Rate of Change indicator can help traders determine the strength of a market trend. It can also be used to determine if the market is overbought or oversold, as well as to confirm that the market is oscillating by looking at it when there is no clear trend in the market.
First, it can be used for trend analysis to identify the strength of a trend. Simply put, when the indicator's value is positive, it indicates that prices have risen more than they have fallen, indicating a relatively strong market trend. Conversely, when it is negative, it indicates that prices are falling more than they are rising, indicating a relatively weak market trend.
In simple terms, you can observe whether the rate of change value breaks through the zero axis. If it breaks up above the zero axis, it means that the current price is rising compared to the previous cycle, indicating that the market may be in an uptrend. If it breaks below the zero-axis, it means that the current price is falling compared to the previous cycle, indicating that the market may be in a downtrend.
Second, it can also determine the buy and sell signals. In actual trading, prices will have different highs and lows over time. The ideal state is to buy at low points and sell at high points. And the rate of change indicator can help find the exact point. When its value breaks from negative to positive above the zero line, a buy signal may be generated, indicating that the market may start to rise. On the contrary, when its value changes from positive to negative, a sell signal may be generated, indicating that the market may start to fall.
And if its value is rising sharply and exceeds a certain threshold, it may indicate that the market is overbought; conversely, when the rate of change falls sharply and falls below a certain threshold, it may indicate that the market is oversold. Again, if its value in a certain period of time has continued to fluctuate above and below the zero line, it represents the market in a state of oscillation, there is no clear trend.
Divergences can also provide certain Trading signals when the price and rate of change indicators are not trending in the same direction. For example, when price makes a new high, but the corresponding rate of change indicator value does not make a new high, forming a negative divergence, may suggest that the market upward momentum is weakening. On the other hand, a positive divergence when price reaches a new low, but the corresponding rate of change indicator value does not reach a new low, suggests that the downward momentum of the market is weakening.
On the daily chart of GBP/USD below, you can see that the price is rising while the rate of change indicator is falling. After that both of them confirmed the downtrend at the same time. In case of Intraday Trading, waiting for the rate of change indicator to break through the zero-axis, you can basically make a profit on a descending candle without risk.
 In addition to the use of this indicator alone, it can also be used in combination with other indicators. For example, when used in conjunction with averages (e.g. the 50th antenna), it can be used to confirm price trends. For example, a stock price above the 50th antenna may be more favorable for a buy decision.
Also, when the rate of change indicator is used in conjunction with moving averages, crossovers are often formed, generating buy and sell signals. For example, when the rate of change indicator crosses its signal line, it may generate a buy signal; when the rate of change indicator crosses the signal line, it may generate a sell signal.
Another example is combined with the parabolic SAR indicator, when the SAR is located below the price, it may be a positive signal; while the SAR is located above the price, it may be a negative signal. If this signal is consistent with the Rate of Change indicator, it helps to confirm the direction of the trend.
When using the ROC indicator, always incorporate an effective risk management strategy. Set stop-loss and take-profit levels to protect against market volatility. And no matter how it is used, it is always recommended to test and adjust it over and over again in real trading and to be flexible according to the actual situation. In addition, do not rely on just one indicator, it is best to use a combination of multiple indicators to improve the accuracy of decision-making.
Optimal parameters for ROC indicator short term
Determining the optimal parameters for short-term trading is often a complex issue, and often requires adjustments based on the characteristics of the specific market and trading instrument, as well as the trading strategy used and personal risk appetite. In general, shorter parameters are appropriate for short-term trading, while longer parameters are appropriate for longer-term investments.
For short term trading it is generally recommended to use a shorter rate of change parameter such as 5 or 7. In the case of day trader, a shorter parameter may be preferred in order to be more sensitive to short term fluctuations in price. In medium-term trading, the parameters of the rate of change indicator may be increased moderately, such as 14 or 20. This reduces the sensitivity of the indicator and better reflects the medium-term trend.
And in long term investing, if used for long term investing or portfolio management, consider longer ROC indicator parameters such as 50. 100 or 200.Longer term parameters can better filter out market noise and reflect a more stable trend.
Also define a trading strategy, including entry and exit rules. Only with a clear understanding of your strategy can you determine how you will use the rate of change indicator. Then try different combinations of parameters and backtest them with historical data to evaluate the performance of different combinations of parameters. Optimization can be done by adjusting the calculation window of the rate of change indicator or other parameters.
Some trading platforms offer parameter optimization tools that can help systematically test different parameter combinations. Such tools are usually able to automate a large number of backtests. It is not only important to optimize the returns of a trading strategy, but also to consider risk management. Maximum retracement, volatility and other risk factors need to be considered when determining the optimal parameters.
Once the optimal parameters have been determined, it is also necessary to monitor the markets in real time and adjust them accordingly. Market conditions may change and flexibility is needed to adapt.
Please note that short-term trading involves a high level of risk and over-optimizing parameters may result in over-fitting historical data and under-performing in the future. Therefore, always be cautious about the performance of any trading strategy and parameters. The choice of optimal parameters may also require constant adjustment due to changing market conditions. It is best to validate and optimize strategies over time by conducting small scale tests in a real market environment.
| Ayers | Characteristics | Scenarios |
| Short-term applications | Short-term trades signaled by rapid price changes. | Short-term traders in dynamic markets. |
| Medium-term applications | Provides insight into medium-term market trends | Medium-term investors assess volatility. |
| Long-term applications | Analyzes long-term trends for market insights. | Long-term investors seek stability. |
Disclaimer:This material is for general information purposes only and is not intended as(and should not be considered to be)financial,investment or other advice on which reliance should be placed.No opinion given in the material constitutes a recommendation by EBC or the author that any particular investment,security,transaction or investment strategy is suitable for any specific person.


World's Best Broker