Published on: 2025-10-29
Updated on: 2025-10-29
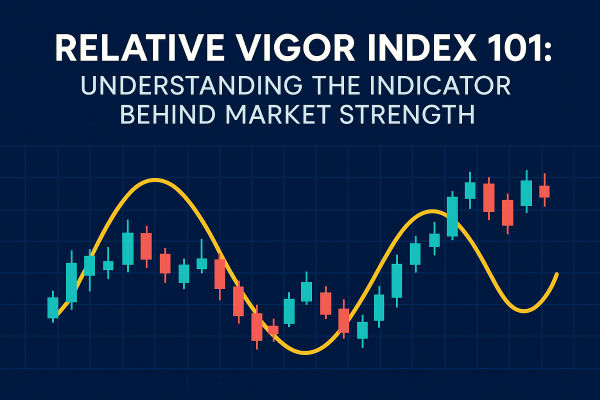
The market often feels like a living organism, pulsing with energy as prices surge and settle. Beneath every rise and fall lies a rhythm that reveals how strong or weak a trend truly is. The Relative Vigor Index, or RVI, is one of the tools traders use to read this rhythm, measuring how convincingly the market moves in a particular direction.
For beginners, understanding the RVI is like learning to read the heartbeat of price action. It’s not about predicting the future but recognising when momentum is healthy or fading. In a world where algorithms react within milliseconds, grasping the logic behind indicators like the RVI can help traders confirm their instincts with structure.

The Relative Vigor Index is a momentum-based technical indicator developed by Donald Dorsey in the late 1990s. Its core principle is that in an uptrend, prices tend to close higher than they open, while in a downtrend, the opposite happens. The RVI measures this relationship to determine whether momentum supports a current trend.
The RVI formula looks at how strong each candle’s close is relative to its range. It compares the difference between closing and opening prices to the full trading range (high minus low) and smooths this data over several periods. The result is a line oscillating around zero, showing when market strength is rising or weakening.
Mathematically, it’s expressed as:
RVI = (Close – Open) / (High – Low), then averaged over a selected number of periods.
A positive RVI reading indicates bullish momentum, while a negative one points to bearish pressure. Traders usually combine the RVI with a signal line (a moving average of the RVI itself) to identify potential crossovers and trend shifts.
The RVI works on the idea of conviction. In strong trends, closing prices often cluster near the extremes of a day’s range. The RVI captures this consistency, confirming whether the strength behind a move is genuine.
For example, during the 2023–2024 bull run in US tech stocks, the Nasdaq Composite rallied more than 40 percent. The RVI on daily charts often remained above zero for weeks, confirming strong buying momentum even during brief corrections. Conversely, when volatility spiked in early 2025 amid interest rate uncertainty, RVI readings frequently crossed below zero, signalling reduced market confidence.
The indicator appears as two lines on a chart: the main RVI line (often green) and its signal line (often red). When the RVI crosses above the signal line, it suggests growing bullish energy; when it crosses below, bearish pressure may be building.
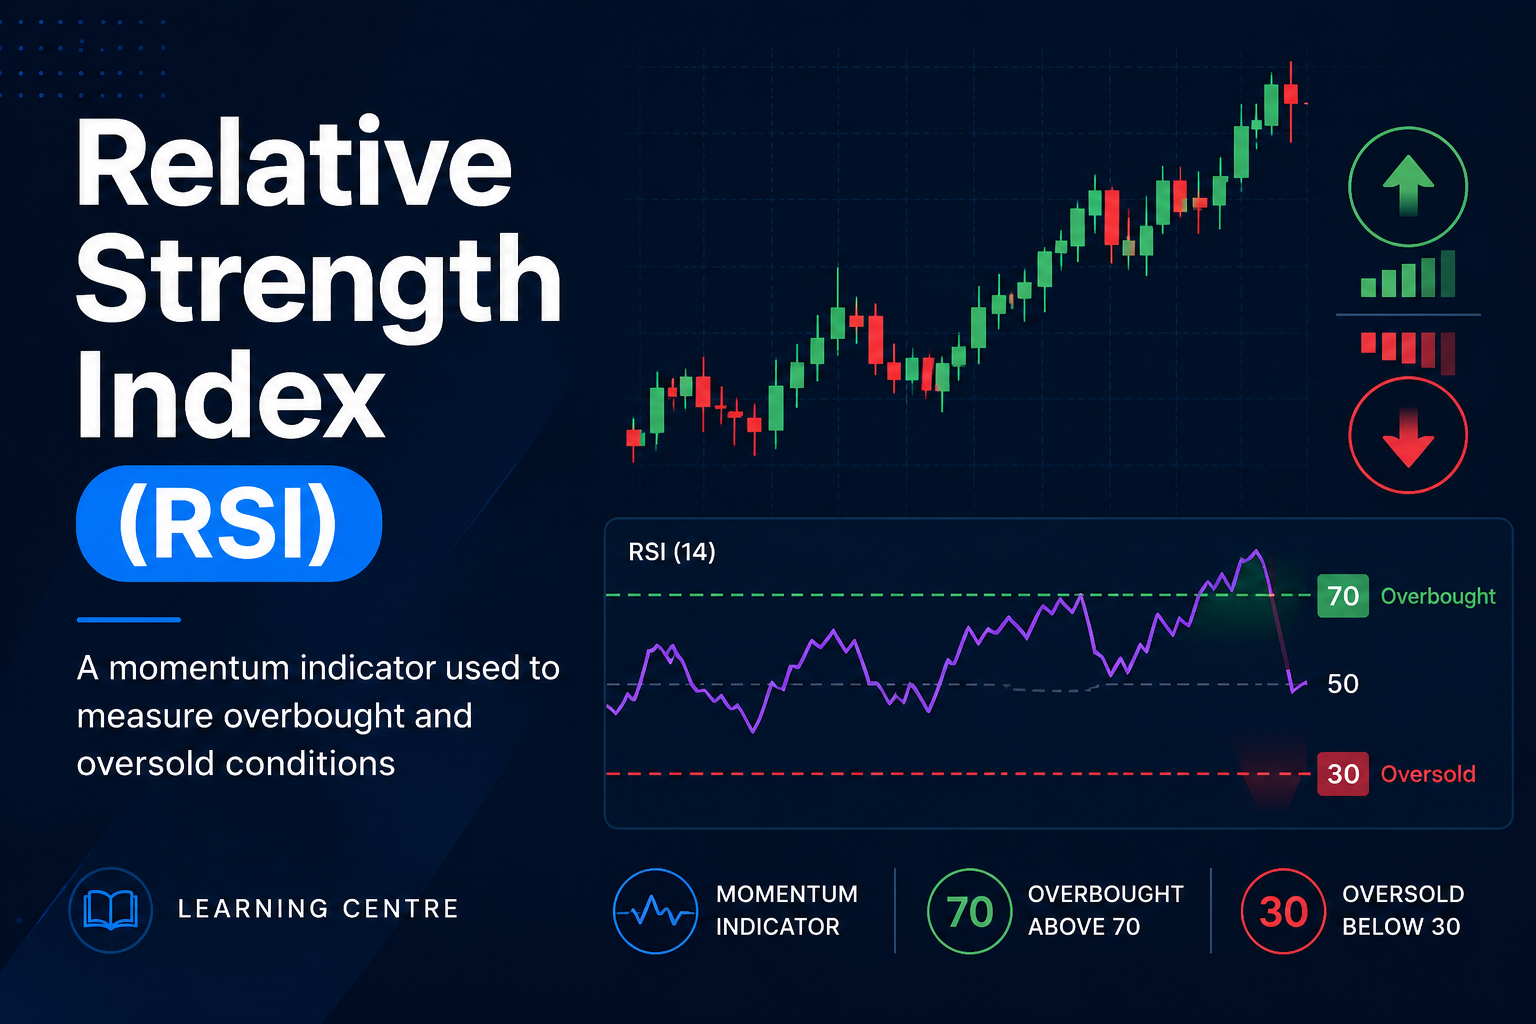
Momentum indicators come in many forms, but the RVI offers a distinct perspective. The Relative Strength Index (RSI) measures speed and magnitude of price changes, while the Moving Average Convergence Divergence (MACD) focuses on the difference between moving averages. The RVI, however, focuses on the consistency of closing strength relative to the daily range.
During steady bullish periods, the RVI tends to remain elevated even as RSI cools off, which helps traders avoid premature exits. In contrast, when the RVI diverges from price direction, it can hint at underlying fatigue before a reversal.
For instance, in September 2024, the EUR/USD pair rose sharply from 1.06 to 1.09, but the RVI flattened and later turned lower even as price continued climbing. A week later, the pair reversed to 1.07, showing how RVI divergence can warn of momentum exhaustion.
The RVI can be incorporated into several trading methods:
Traders use the RVI to verify that a breakout or rally has genuine strength. If the RVI remains above zero and the signal line supports it, momentum is likely healthy.
When price makes a new high but the RVI does not, it may signal a weakening trend. For example, during Tesla’s rally in early 2025, RVI divergence appeared just before a 12 percent retracement in the stock’s price.
Experienced traders often cross-check the RVI across daily and 4-hour charts. If both show the same directional signal, it confirms higher-probability setups.
A bullish crossover occurs when the RVI line rises above its signal line, suggesting potential upward movement. A bearish crossover does the opposite. Many traders combine these signals with moving averages or volume analysis for confirmation.
It helps confirm trend strength rather than predicting tops or bottoms.
It performs well in trending markets with steady momentum.
It complements other indicators by focusing on the quality of price closes.
It can be applied to any market, from forex to equities and commodities.
The RVI is not perfect. Because it smooths data over several periods, it can lag behind fast price changes. During sharp news-driven moves, it might react after the market has already shifted. It also produces false signals in range-bound or choppy markets, where momentum fluctuates frequently.
For example, during the 2022 energy price shock, crude oil prices spiked unpredictably, and the RVI produced multiple conflicting signals. In such conditions, combining it with volatility filters or moving average trends helps reduce noise.

The RVI measures how strongly a market’s closing prices support its current direction, indicating whether momentum aligns with price movement.
While RSI measures the speed of price movement, RVI focuses on the consistency of closes relative to each period’s range, offering a steadier gauge of conviction.
It’s best used alongside indicators like MACD or volume analysis. On its own, it confirms trends but doesn’t always give early entry or exit points.
The Relative Vigor Index gives traders a structured view of market energy. It filters out emotional bias by showing when enthusiasm or pessimism is truly supported by price behaviour. By focusing on the strength of closing moves, the RVI helps traders make decisions based on conviction rather than reaction.
Momentum, like wind in a sail, is invisible but essential. The RVI doesn’t predict which direction the wind will blow, but it tells you how strong it currently is. In a marketplace dominated by speed, that perspective can mean the difference between chasing noise and following strength.
Momentum Indicator: A tool that measures how fast or strong prices move.
Divergence: A condition where the price and the indicator move in opposite directions, signalling a potential trend change.
Signal Line: A smoothed version of the main indicator line used to confirm crossovers.
Disclaimer: This material is for general information purposes only and is not intended as (and should not be considered to be) financial, investment or other advice on which reliance should be placed. No opinion given in the material constitutes a recommendation by EBC or the author that any particular investment, security, transaction or investment strategy is suitable for any specific person.