Published on: 2025-12-09
Updated on: 2025-12-09
Market Profile is widely regarded as one of the most sophisticated yet practical tools for understanding market behaviour. Instead of viewing price purely as movement on a chart, Market Profile allows traders to observe where the market accepted value, where it rejected price, and how the auction process evolved throughout a session.
In fast-changing markets, the ability to read structure, rather than relying solely on indicators, gives traders an analytical advantage. Market Profile does exactly that by combining time, price, and volume into a visual distribution that reflects real trader activity and intent.
This expanded guide explores Market Profile in depth, covering its structure, its analytical value, and the practical strategies used by skilled traders worldwide.

Market Profile is based on the principle that markets function as continuous auctions. Prices move higher until buyers withdraw and lower until sellers retreat. Within this dynamic, certain prices attract heavy activity, while others are quickly abandoned.
Market Profile visualises this behaviour by showing:
How long the market stayed at each price
Which price levels generated the most interest
Where traders perceived fair value
Where imbalances pushed the market into new territory
Originally introduced by J. Peter Steidlmayer at the Chicago Board of Trade, Market Profile was developed to make market structure more visible. It remains relevant today because it reveals the forces behind price movement, not just the movement itself.
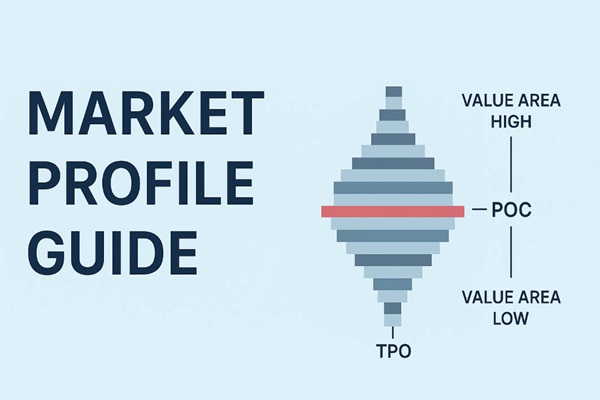
A TPO is the basic building block of Market Profile. Each TPO represents a segment of time, usually 30 minutes, during which a price level was traded. These TPOs are assigned letters and stacked to form a distribution.
Why this matters:
The more TPOs accumulated at a particular price, the more time the market spent there, signalling value acceptance.
The POC is the price level with the highest TPO count within a session. It reflects the strongest consensus between buyers and sellers. Because it represents equilibrium, price often revisits the POC during later sessions.
The POC is frequently used for:
Retracement entries
Establishing support and resistance
Evaluating whether the market has shifted value
The Value Area contains roughly 70 percent of all TPOs. This range reflects the session’s fair value zone — the territory where most trading occurred.
Key insights from the Value Area include:
Acceptance when price remains within the range
Rejection when price touches but fails to remain in the zone
Breakout potential when price leaves the zone with strength
Traders monitor Value Area High (VAH) and Value Area Low (VAL) for trade setups involving reversion, breakout, or continuation.
The Initial Balance refers to the price range formed by the market’s early session behaviour. It often sets the tone for the remainder of the session.
A large Initial Balance may signal caution and balance.
A narrow Initial Balance may suggest impending expansion or directional movement.
The IB helps traders identify day types such as:
Normal day
Normal variation
Trend day
Double distribution day
Neutral day
Each structure offers different opportunities and clues about market intent.
Market Profile distributions take several forms, each signalling specific behaviour:
Normal distribution: balanced, mean-reverting conditions
Trending distribution: elongated shape, single-direction conviction
Double distribution: value shifted mid-session
P-shaped: short covering or initial upward imbalance
b-shaped: long liquidation or downward imbalance
Recognising these shapes helps traders align expectations with structure.

Reading Market Profile effectively requires observing both micro-structures and session-wide patterns. Here is the step-by-step process professional traders follow:
Start by locating the Value Area High, Value Area Low, and the session's POC. These levels form the foundation of all Market Profile analysis and provide immediate orientation.
A balanced profile usually suggests range-bound activity, encouraging mean-reversion approaches.
An imbalanced profile often indicates directional conviction and potential trend continuation.
Long tails typically indicate strong rejection.
For example:
A long upper tail suggests sellers rejected higher prices
A long lower tail shows buyers rejected lower prices
These zones often remain significant in future sessions.
A rising POC indicates buyers winning control.
A falling POC signals sellers strengthening influence.
A static POC implies equilibrium.
Market Profile is most powerful when sessions are analysed in sequence.
Look for:
Value migration
POC shifts
Whether the market is accepting or rejecting prior ranges
Expansion beyond previous limits
This inter-session comparison puts each session in context and supports more accurate trade planning.

When price moves far from the Value Area without strong continuation, traders anticipate a return to fair value. This approach is often used in balanced markets where the auction has not found acceptance at extremes.
When the market compresses within a tight Value Area and breaks out with directional strength, traders expect continuation. Confirmation typically includes:
Expanding TPO distribution
A shifting POC
Accepted trading above or below the previous Value Area
The POC frequently attracts price because it represents the price level where both sides previously agreed on value. In rotational markets, the POC often becomes a reliable reference for retracement entries.
Long tails highlight prices that market participants firmly rejected. These areas often act as powerful boundaries or reversal points, especially during high-volume sessions.
If the Value Area continuously rises, the market is accepting higher prices.
If the Value Area continues to fall, sellers are gaining control.
Tracking these migrations helps traders anticipate future behaviour with greater precision.
Market Profile combines time, price, and trading activity into a single distribution, showing where value was accepted or rejected. This reveals underlying behaviour and intent, whereas traditional charts only display price movement without structural context.
The Value Area highlights the range where roughly 70 percent of activity occurred, forming the session’s fair value zone. Traders analyse moves outside this area to identify breakouts, rejections, or reversion setups, improving clarity and decision accuracy.
The POC marks the price where the market spent the most time, indicating equilibrium. It often acts as a magnet during future sessions and helps traders identify high-probability support, resistance, and retracement opportunities with increased confidence.
Yes. Intraday traders rely on Market Profile to track session structure, observe Initial Balance breakouts, monitor Value Area shifts, and recognise developing imbalances. These elements help define trade locations and improve the precision of risk and entry management.
Market Profile is most effective when markets follow typical auction behaviour. Extremely volatile or news-driven sessions can distort its structure, making Value Areas and POCs less reliable unless supported by additional tools and contextual analysis.
Market Profile allows traders to understand the market's internal logic rather than focusing solely on price movement. By revealing accepted value, rejected extremes, and session-to-session structural development, it offers traders a level of clarity unmatched by conventional charting.
Mastering Market Profile supports a disciplined approach, improves timing, and enables traders to navigate fast or uncertain markets with greater confidence. Whether applied to intraday trading or broader market analysis, the framework provides a robust foundation for smarter, more informed decision-making.
Disclaimer: This material is for general information purposes only and is not intended as (and should not be considered to be) financial, investment or other advice on which reliance should be placed. No opinion given in the material constitutes a recommendation by EBC or the author that any particular investment, security, transaction or investment strategy is suitable for any specific person.