Published on: 2025-08-08
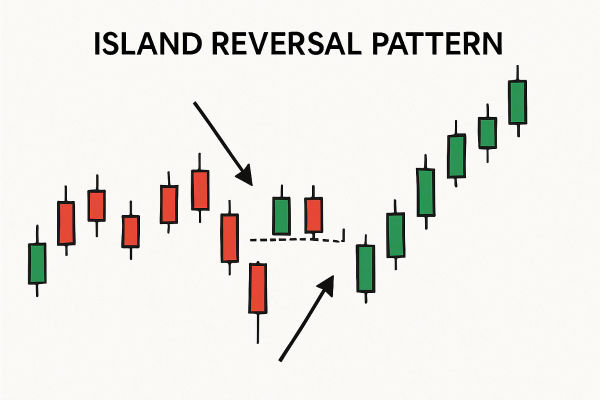
The Island Reversal Pattern is a chart formation that signals a sudden and strong reversal in price direction. It typically occurs after a significant upward or downward move.
It consists of a cluster of price action isolated from the previous and subsequent moves by two gaps, one before and one after the "island" of trading activity.
This article will explain what the Island Reversal Pattern is, break down its types, show real-world examples, and offer practical trading tips so you can identify and potentially profit from it.

The pattern usually develops in three key stages:
The Initial Gap: The market gaps strongly in the direction of the prevailing trend, creating excitement among traders and often encouraging more participants to jump in.
Consolidation on the Island: Price action trades in a narrow range for a few days or weeks, forming the "island." Trading activity might decrease during this period as market participants anticipate the next decision.
The Reversal Gap: Price gaps sharply in the opposite direction, trapping traders who entered during the initial gap and signalling a reversal in market sentiment.
The defining characteristic is that prices seem to be "stranded" on the chart, creating a visual island surrounded by gaps in opposite directions. These gaps frequently result from sudden shifts in market sentiment, news announcements, or unforeseen occurrences.
While patterns in trading can sometimes be subjective, the Island Reversal has distinct features that make it easier to identify:
Two opposite gaps (one at the start and one at the end of the island).
Isolated price action between the gaps.
Volume spike often accompanies the reversal gap.
Usually forms over a short time frame (days or weeks).
This pattern is important because it's one of the few technical formations that can signal an abrupt market reversal without gradual warning signs. Traders who can spot it early often have the opportunity to position themselves for rapid and profitable moves.
It also offers a clear risk-to-reward framework since the gaps provide obvious points for stop-loss placement.

1. Bullish Island Reversal
A bullish island reversal occurs after a downtrend. The market gaps down, consolidates for a period, and then gaps sharply upward. It suggests that sellers have lost control and buyers are stepping in aggressively.
Example: A stock in a prolonged decline gaps down after disappointing earnings. Over the next week, the price swings sideways. Then, unexpectedly, positive economic data causes a gap up, marking the start of a new uptrend.
Why It's Good for Traders:
Offers a clear entry point after a confirmed shift in sentiment.
It can signal the start of a strong rally.
2. Bearish Island Reversal
A bearish island reversal happens after an uptrend. The market gaps up, trades sideways, and then gaps down sharply. It is a sign that bullish momentum has stalled and sellers have taken control.
Example: A currency pair in a strong uptrend gaps up due to optimistic central bank announcements. It stabilises for a few days, but when inflation figures are released worse than anticipated, the market gaps down, initiating a bearish trend.
Why It's Good for Traders:
Allows traders to exit long positions before large losses.
Offers opportunities for short trades in newly forming downtrends.

1. Identify the Initial Gap
Watch for strong gaps in the direction of the current trend. Not all gaps will lead to an island reversal, but this is your starting point.
2. Confirm the Consolidation Phase
The price moves sideways for a period. The longer the consolidation, the more significant the eventual reversal can be.
3. Look for the Reversal Gap
It is the most important signal. A sharp gap in the opposite direction often confirms the reversal.
4. Set Your Entry Point
Enter the trade after the reversal gap is confirmed. For bullish reversals, enter long; for bearish reversals, enter short.
5. Manage Risk
Place stop-loss orders just outside the opposite side of the island to protect against false signals.
Example
Let's say gold (XAU/USD) has been climbing steadily for weeks due to geopolitical tensions.
One morning, it gaps up due to an unexpected event, then trades sideways for four days. Suddenly, news breaks that tensions have eased, causing gold to gap down sharply.
Traders who recognised this bearish island reversal could have entered short positions and profited as gold dropped further.
| Advantages | Disadvantages |
|---|---|
| Offers clear entry and exit points | Can be rare, so opportunities are limited |
| Strong signal of trend reversal | False signals possible in low-volume markets |
| Works in multiple markets (stocks, forex, commodities) | Requires quick reaction time |
| Easy to spot visually | Gaps can sometimes be hard to trade depending on broker execution |
Q1. Is the Island Reversal Pattern Bullish or Bearish?
A: It can be both. A bullish island reversal forms after a downtrend and signals a potential upward move, while a bearish island reversal forms after an uptrend and signals a possible downward reversal.
Q2. Which Markets Can the Island Reversal Pattern Be Used In?
A: The Island Reversal Pattern appears in multiple markets, including stocks, forex, commodities, and indices. It's most effective in volatile markets where price gaps are more common.
Q3. How Reliable Is the Island Reversal Pattern for Traders?
A: While the pattern can be highly reliable when confirmed, it's relatively rare and works best when combined with other technical indicators like volume analysis, RSI, or MACD for confirmation.
In conclusion, the Island Reversal Pattern is one of the more powerful reversal signals in technical analysis.
Although not an everyday occurrence, when an island reversal appears, it indicates a massive shift in market direction, justifying its place in your trading toolkit.
Disclaimer: This material is for general information purposes only and is not intended as (and should not be considered to be) financial, investment or other advice on which reliance should be placed. No opinion given in the material constitutes a recommendation by EBC or the author that any particular investment, security, transaction or investment strategy is suitable for any specific person.