Published on: 2025-06-05
The long legged doji is a candlestick pattern that traders watch for signs of market indecision and a possible shift in direction. By learning how to interpret the long legged doji, you can better judge when momentum is weakening and when the market may need confirmation before its next move.
This article explains what the long legged doji represents, how to recognise it on your charts, how traders typically confirm it, and how to use it within a broader trading strategy.

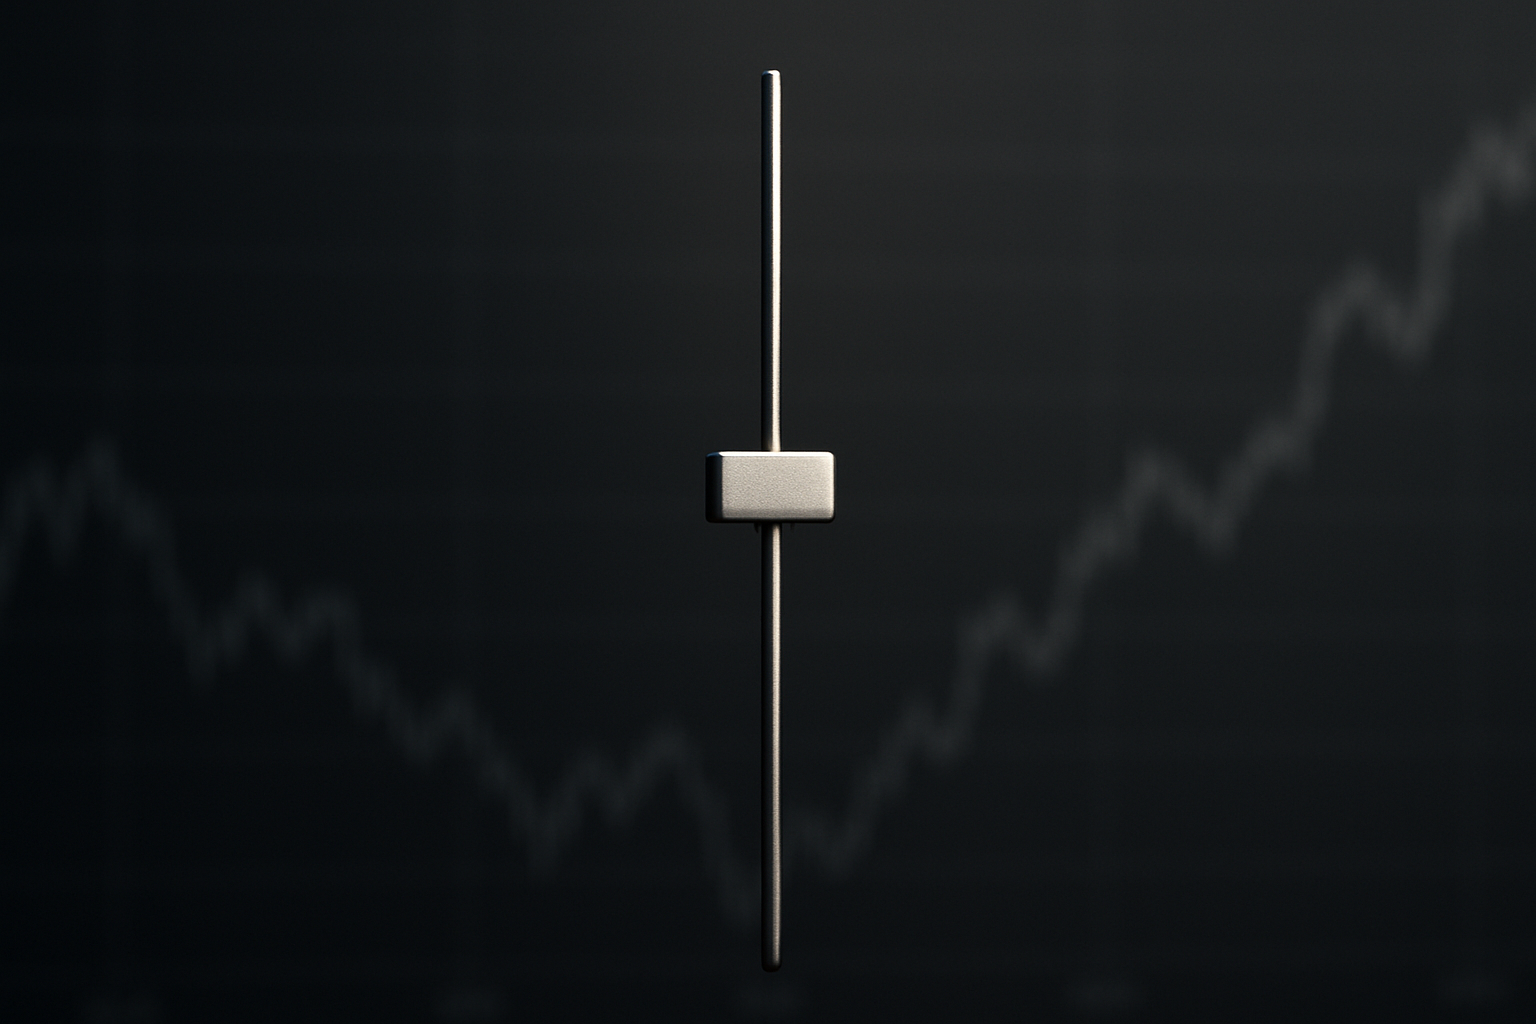
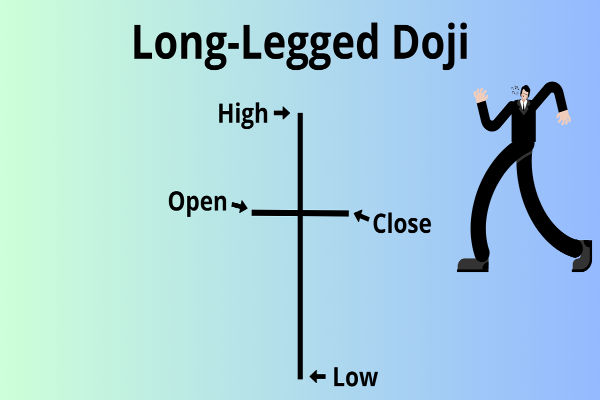
At its core, the long legged doji is a candlestick that shows the opening and closing prices are almost identical, resulting in a very small or nonexistent real body. However, what makes it stand out are the long upper and lower shadows.
These shadows reflect a tug-of-war during the trading session, where buyers pushed prices high but sellers also forced the price down significantly, before it settled near the opening price. This pattern is a clear visual representation of uncertainty within the market.
The long legged doji often appears after strong price trends, either up or down. Its presence suggests that the momentum behind the prevailing trend may be weakening. Because the market is indecisive, the pattern often warns traders to pause and look for additional confirmation before entering new positions.

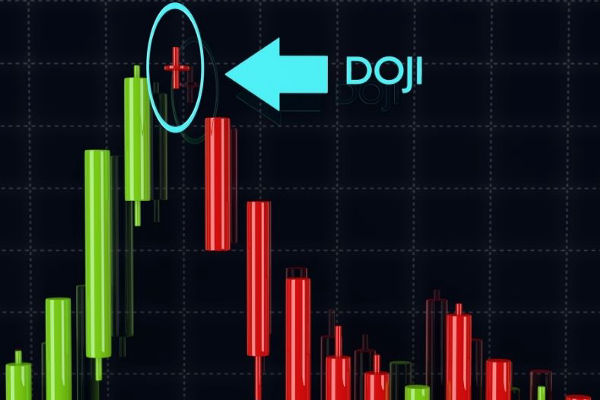
Spotting a long legged doji on your chart involves looking for a very small real body with long wicks on both sides.
Unlike other types of doji patterns, such as the gravestone or dragonfly doji, the long legged doji shows price rejection both above and below the open and close. The shadows are usually much longer than the body, although they do not need to be perfectly symmetrical.
The long shadows indicate high volatility during the session, with intense struggles between buyers and sellers. When you see this pattern, it is a signal that neither side has taken control, leading to a stalemate situation.
When the long legged doji forms, it shows that buyers and sellers pushed hard in both directions but neither side kept control into the close. That makes it a neutral pattern on its own, not an automatic bullish or bearish signal.
After a strong uptrend or downtrend, the pattern can warn that momentum is fading and that a reversal is possible. In a sideways market, it may simply reflect a pause before price continues to range or breaks out later.
Because the long legged doji is a warning sign rather than a confirmation, traders usually wait for the next candle, nearby market structure, and volume before acting.
To use the long legged doji effectively, it is important to assess it alongside other market indicators and price action. Volume can add useful context. A long legged doji that forms on elevated trading volume may show a more meaningful struggle between buyers and sellers, but volume alone still does not confirm direction.
Many traders wait for the next candle to provide confirmation. In a downtrend, a strong bullish close after the doji can suggest buyers are taking control. In an uptrend, a bearish close after the doji can suggest sellers are gaining ground.
A common risk approach is to use the doji high or low, or the confirming candle, as a reference point for invalidation rather than entering immediately when the doji appears.
Another important consideration is the location of the long legged doji on the chart. If the pattern forms near major support or resistance levels, the chance of a meaningful price reaction may increase.
This makes the pattern more useful when it is combined with clear market structure instead of viewed in isolation.
New traders often make the mistake of assuming that every long legged doji guarantees a trend reversal. In reality, the pattern reflects indecision and can lead to either reversal, continuation, or further consolidation depending on where it appears.
It is important to integrate other tools such as trend analysis, momentum indicators such as RSI or MACD, and fundamental context to reduce false signals.
Immediate action after a long legged doji without confirmation can lead to poor trading outcomes.
Patience matters; waiting for subsequent price action and supporting evidence can improve trade selection and risk control.

The long legged doji is just one member of the doji family, and each variation has different trading implications. The gravestone doji, for example, has a long upper shadow and little to no lower shadow, which often points to failed buying pressure.
The dragonfly doji, on the other hand, has a long lower shadow and minimal upper shadow, which can reflect failed selling pressure.
What makes the long legged doji unique is its balanced upper and lower shadows, which show that price was rejected in both directions during the session.
That balance often signals a higher level of indecision than other doji types, which is why traders usually rely more heavily on context and confirmation before making a decision.
Imagine a currency pair that has been rising steadily over several sessions and then prints a long legged doji on the daily chart near a known resistance area.
The candle shows that buyers pushed higher but could not hold control into the close. If the next day closes lower with clear bearish follow-through, some traders may treat that as confirmation that upside momentum is weakening.
At that point, they may look for short setups or tighten risk on existing long positions rather than assuming the doji alone has already confirmed a reversal.
The long legged doji is a useful pattern for reading market sentiment and spotting moments when conviction starts to weaken. Its long shadows and small body show a strong intraperiod battle between buyers and sellers, but the candle itself is neutral until other evidence appears.
When it is combined with volume, confirmation candles, and key support or resistance levels, the long legged doji can become a more practical part of a broader technical analysis strategy.
Used with patience, context, and risk management, it can help traders read price action more clearly and avoid acting on weak signals.
Disclaimer: This material is for general information purposes only and is not intended as (and should not be considered to be) financial, investment or other advice on which reliance should be placed. No opinion given in the material constitutes a recommendation by EBC or the author that any particular investment, security, transaction or investment strategy is suitable for any specific person.